Asa’s R packages 📦
for bioinformatics and data analysis
2024-04-19
My R packges
![]()
![]()
My favorite programming language is R, I have developed some R packages:
pcutils 
It contains many useful functions for statistics and visualization.
Go down 👇
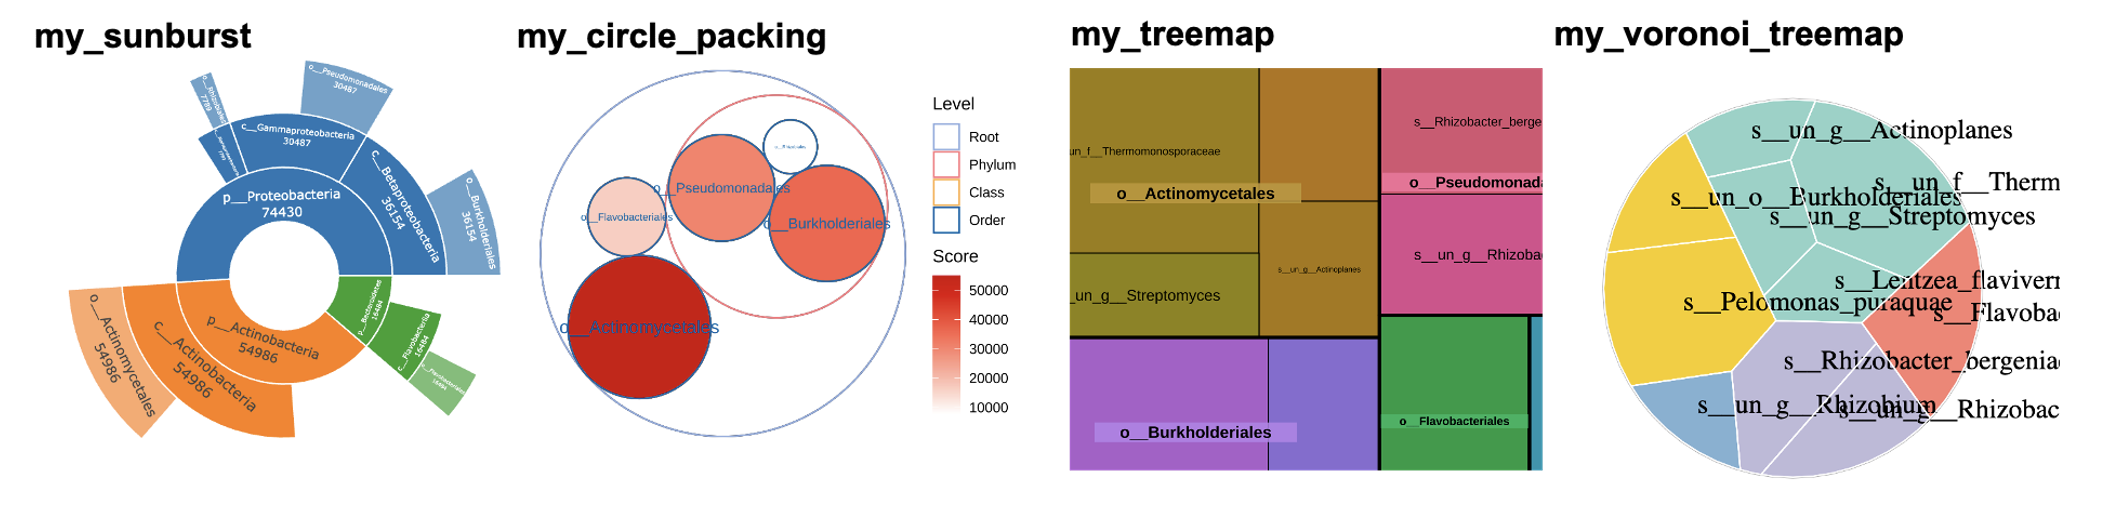
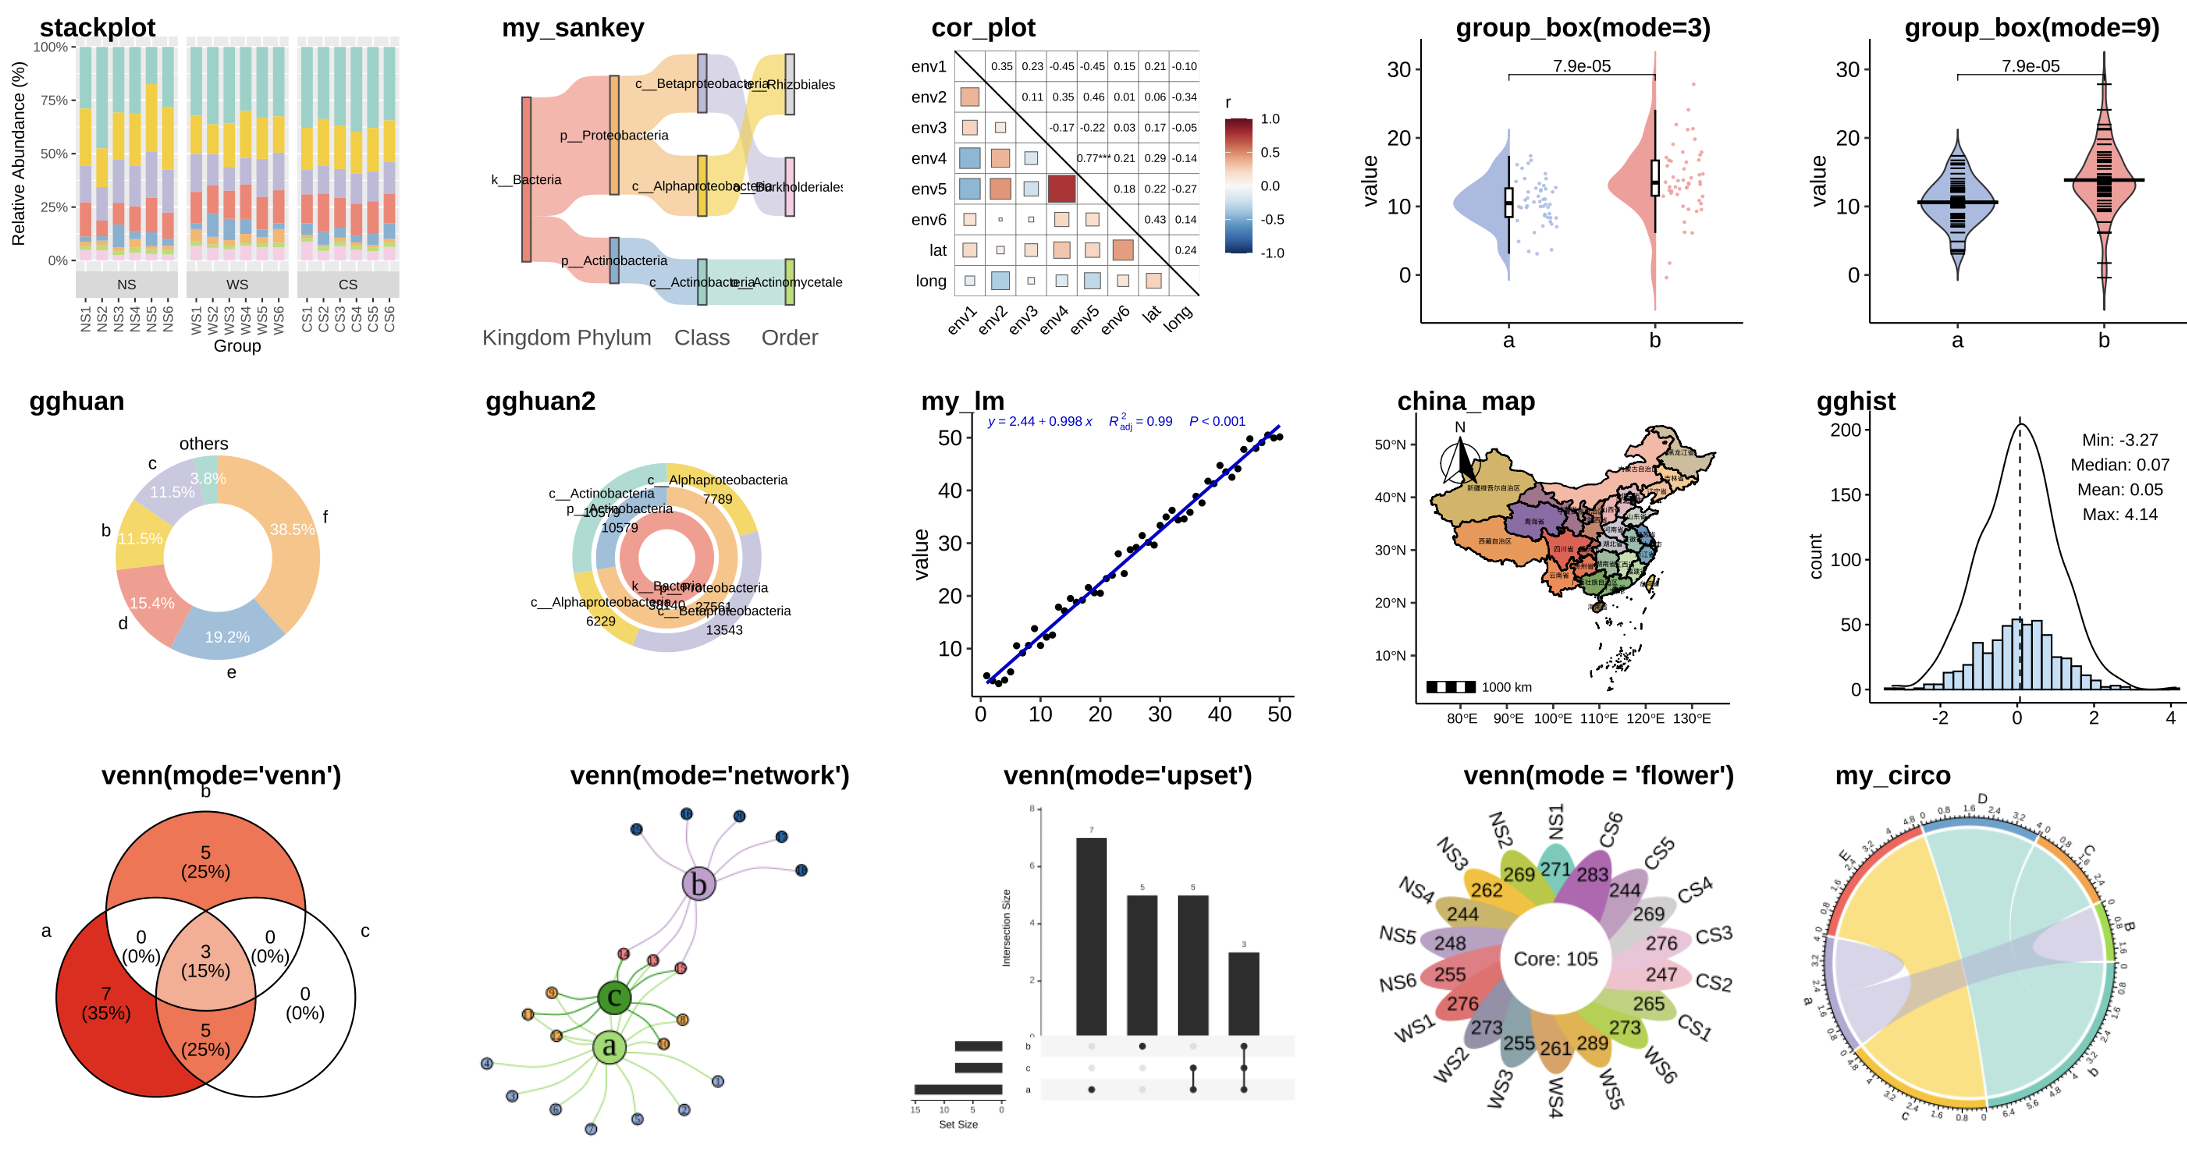
pctax 
- It contains a basic pipeline for omics analysis.
- See the pctax Tutorial
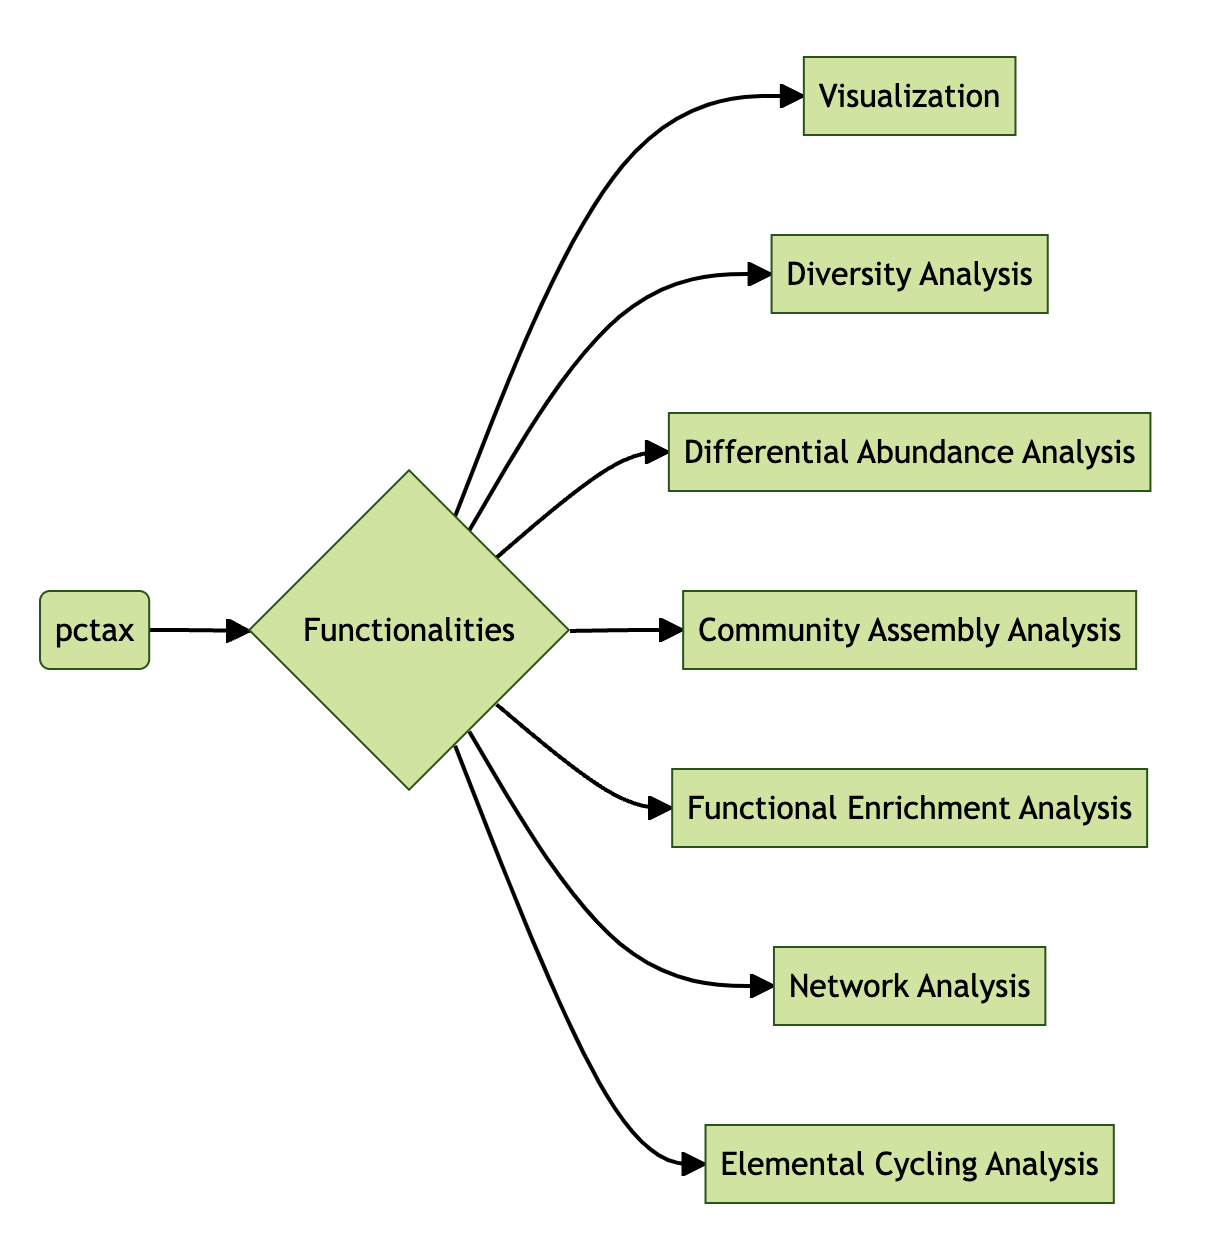
pctax features
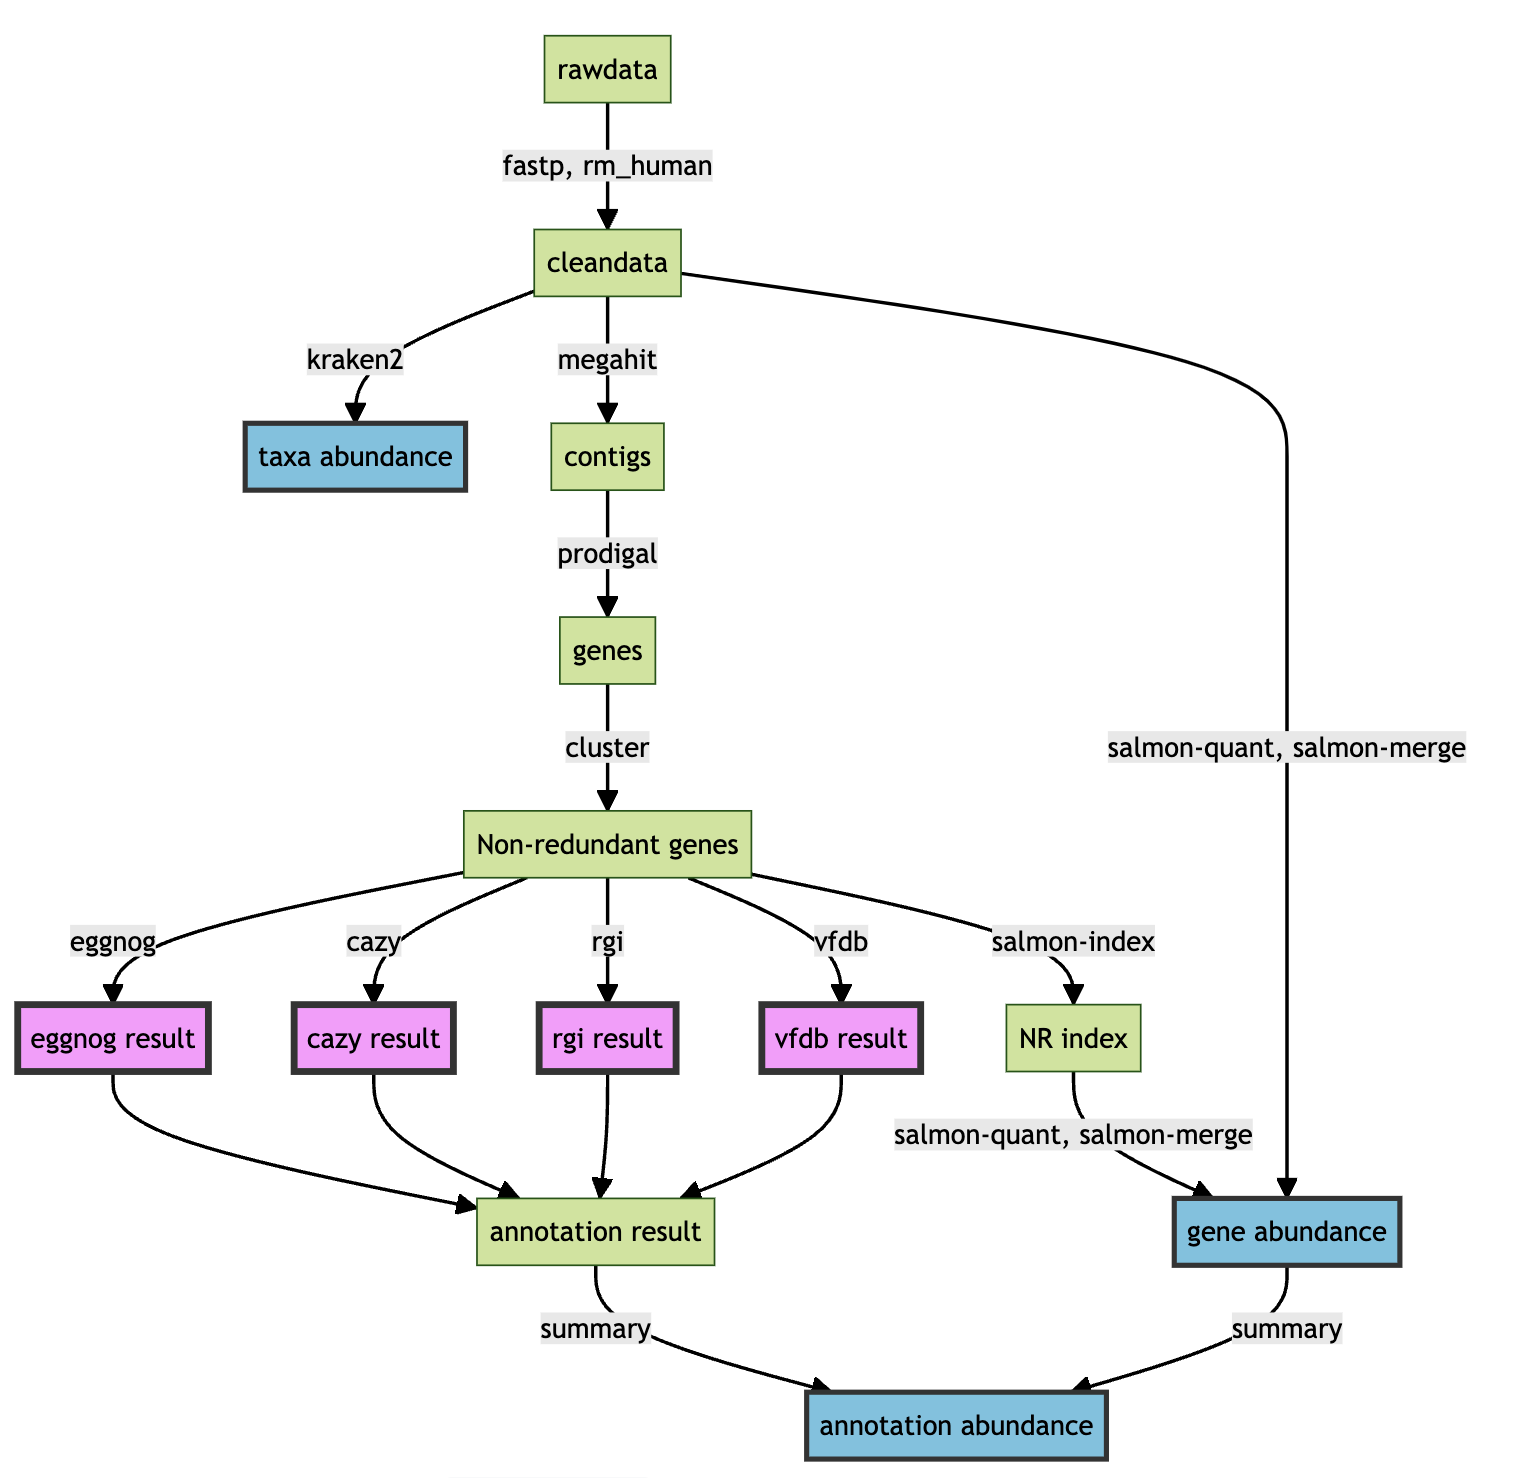
Built-in steps in the micro_sbatch():
- fastp
- rm_human
- kraken2
- megahit
- prodigal
- cluster
- salmon-quant
- eggnog
- cazy
- rgi
- vfdb
- …
Taxonkit is a Practical and Efficient NCBI Taxonomy Toolkit.
You can use Taxonkit in R by pctax interface as followed:
  taxid      Kingdom            Phylum                  Class
1   562  k__Bacteria p__Pseudomonadota c__Gammaproteobacteria
2  9606 k__Eukaryota       p__Chordata            c__Mammalia
                Order                Family          Genus             Species
1 o__Enterobacterales f__Enterobacteriaceae g__Escherichia s__Escherichia coli
2         o__Primates          f__Hominidae        g__Homo     s__Homo sapiens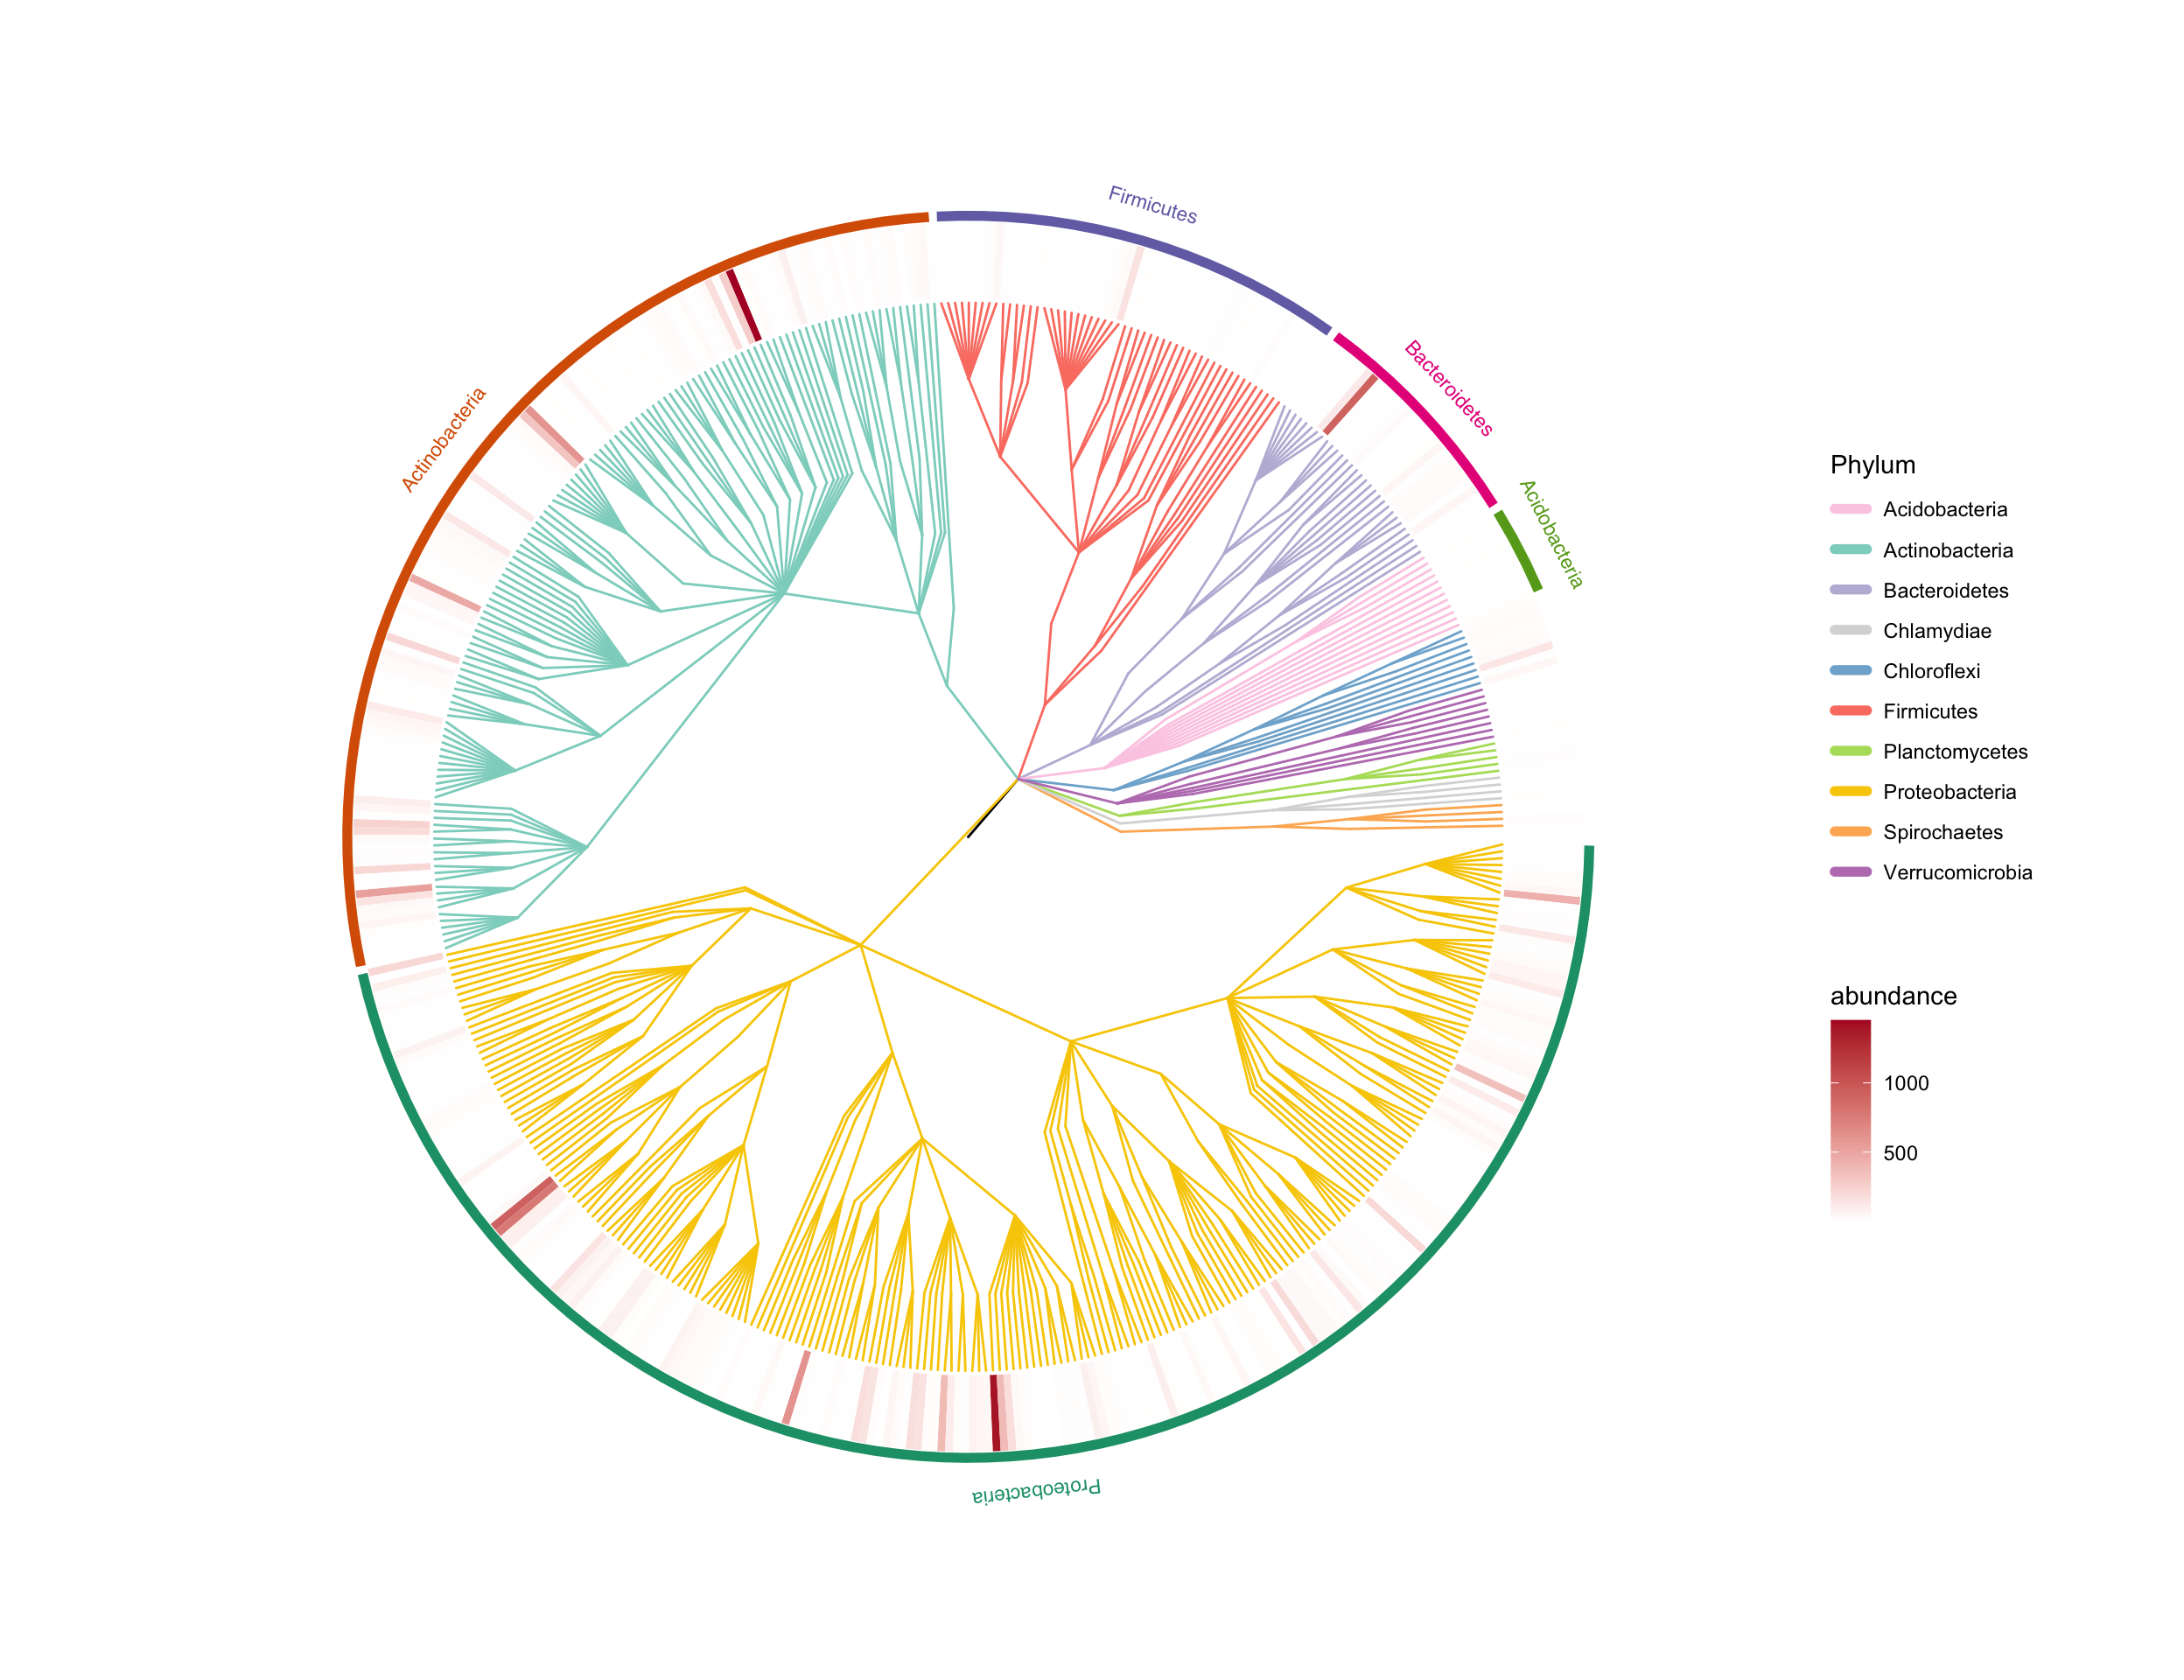
Unified input and output format of one type of analysis for convenient downstream
- α-diversity
- Richness, Shannon, Simpson, Chao1, ACE, PD, Pielou, …
- β-diversity
- Distance: Bray-Curtis, Jaccard, Unifrac, Beta MPD, Phylosor, …
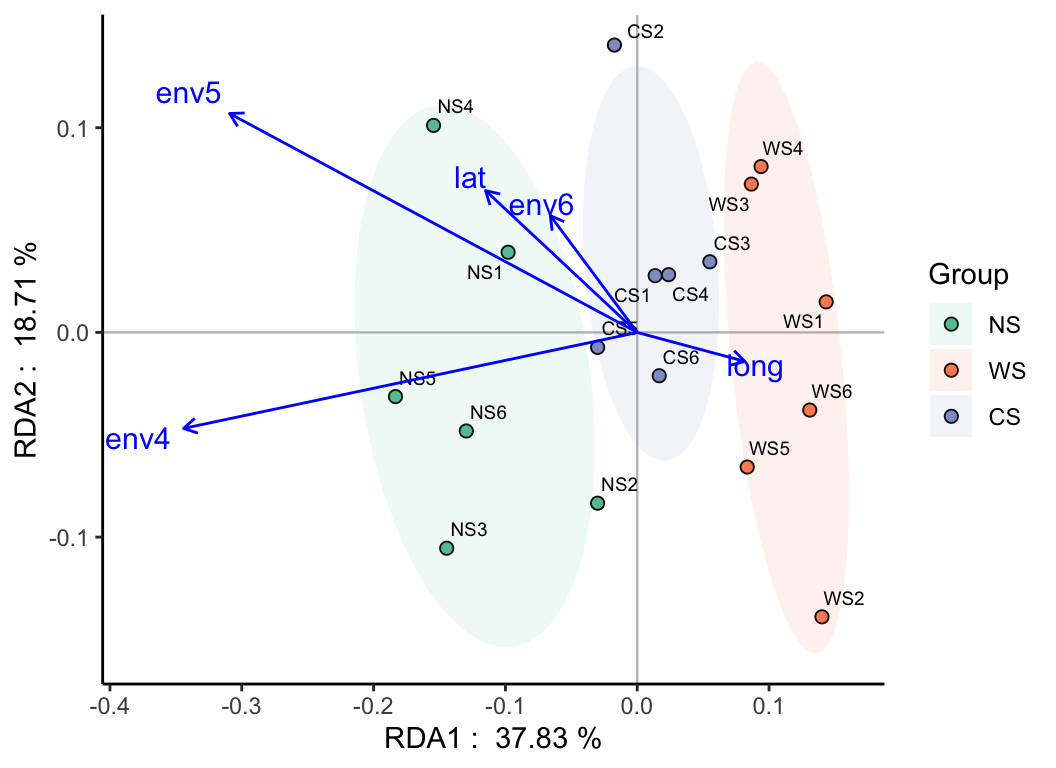
- Ordination: PCA, PCoA, NMDS, PLS-DA, t-SNE, UMAP, LDA, RDA, CCA, db-RDA, …
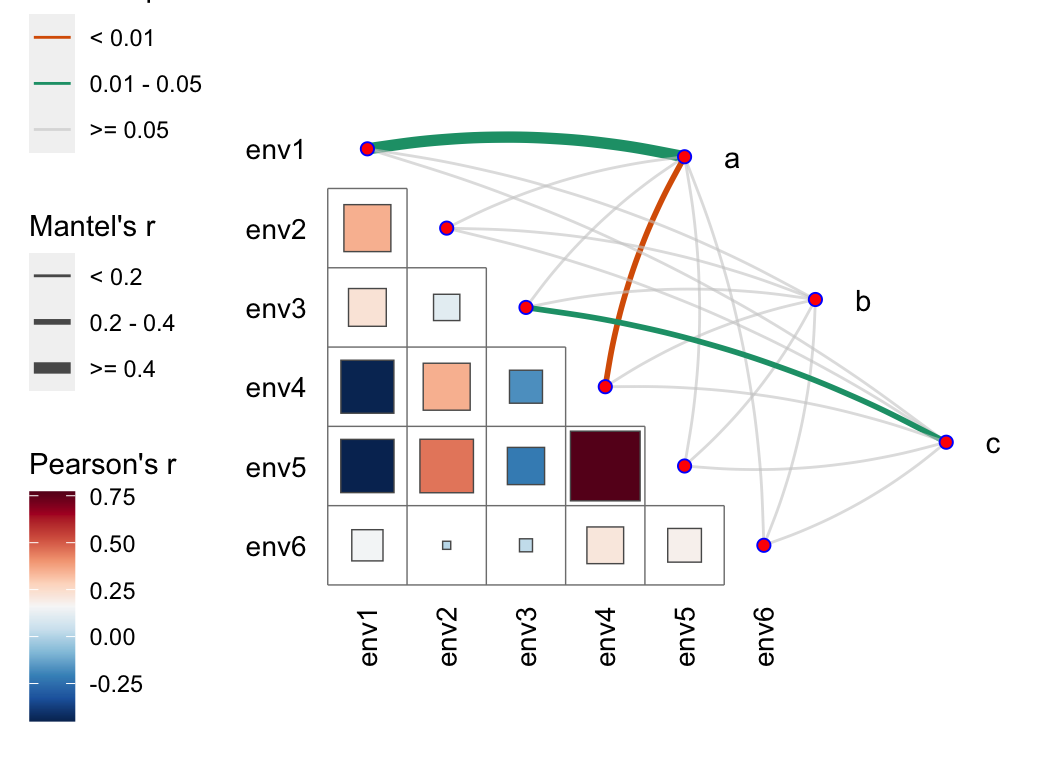
- PERMANOVA: adonis, anosim, mrpp, mantel, envfit, …
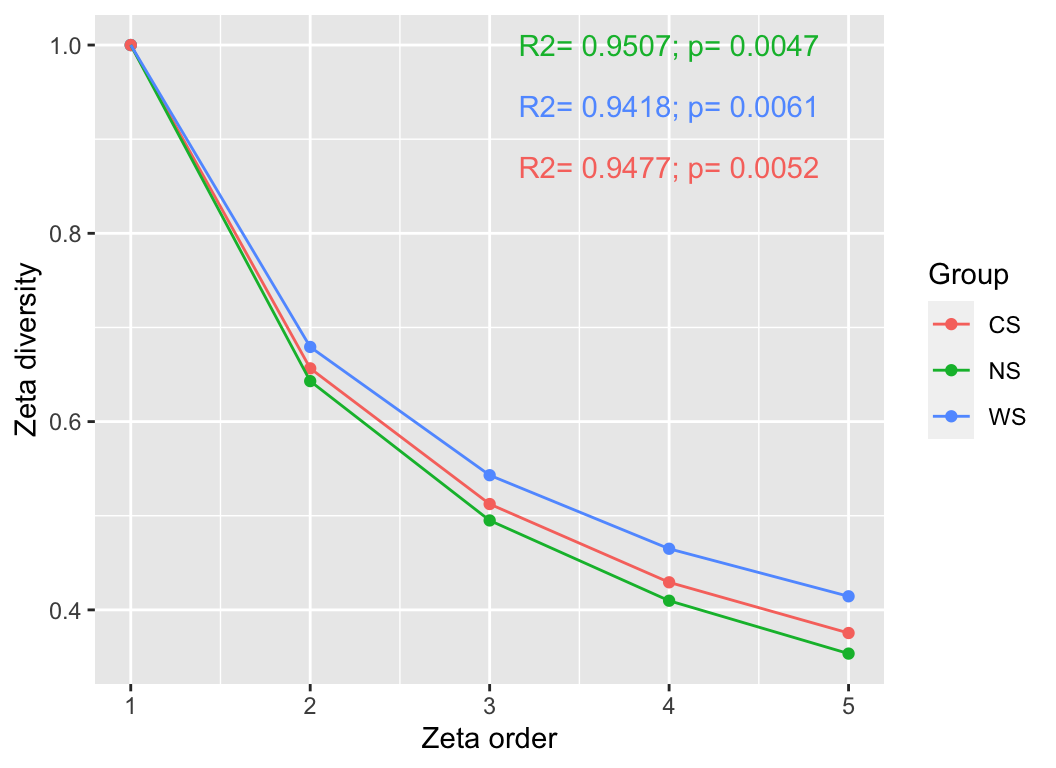
- ζ-diversity
pctax features
- t.test
- wilcox.test
- DESeq2
- edgeR
- limma
- randomForest
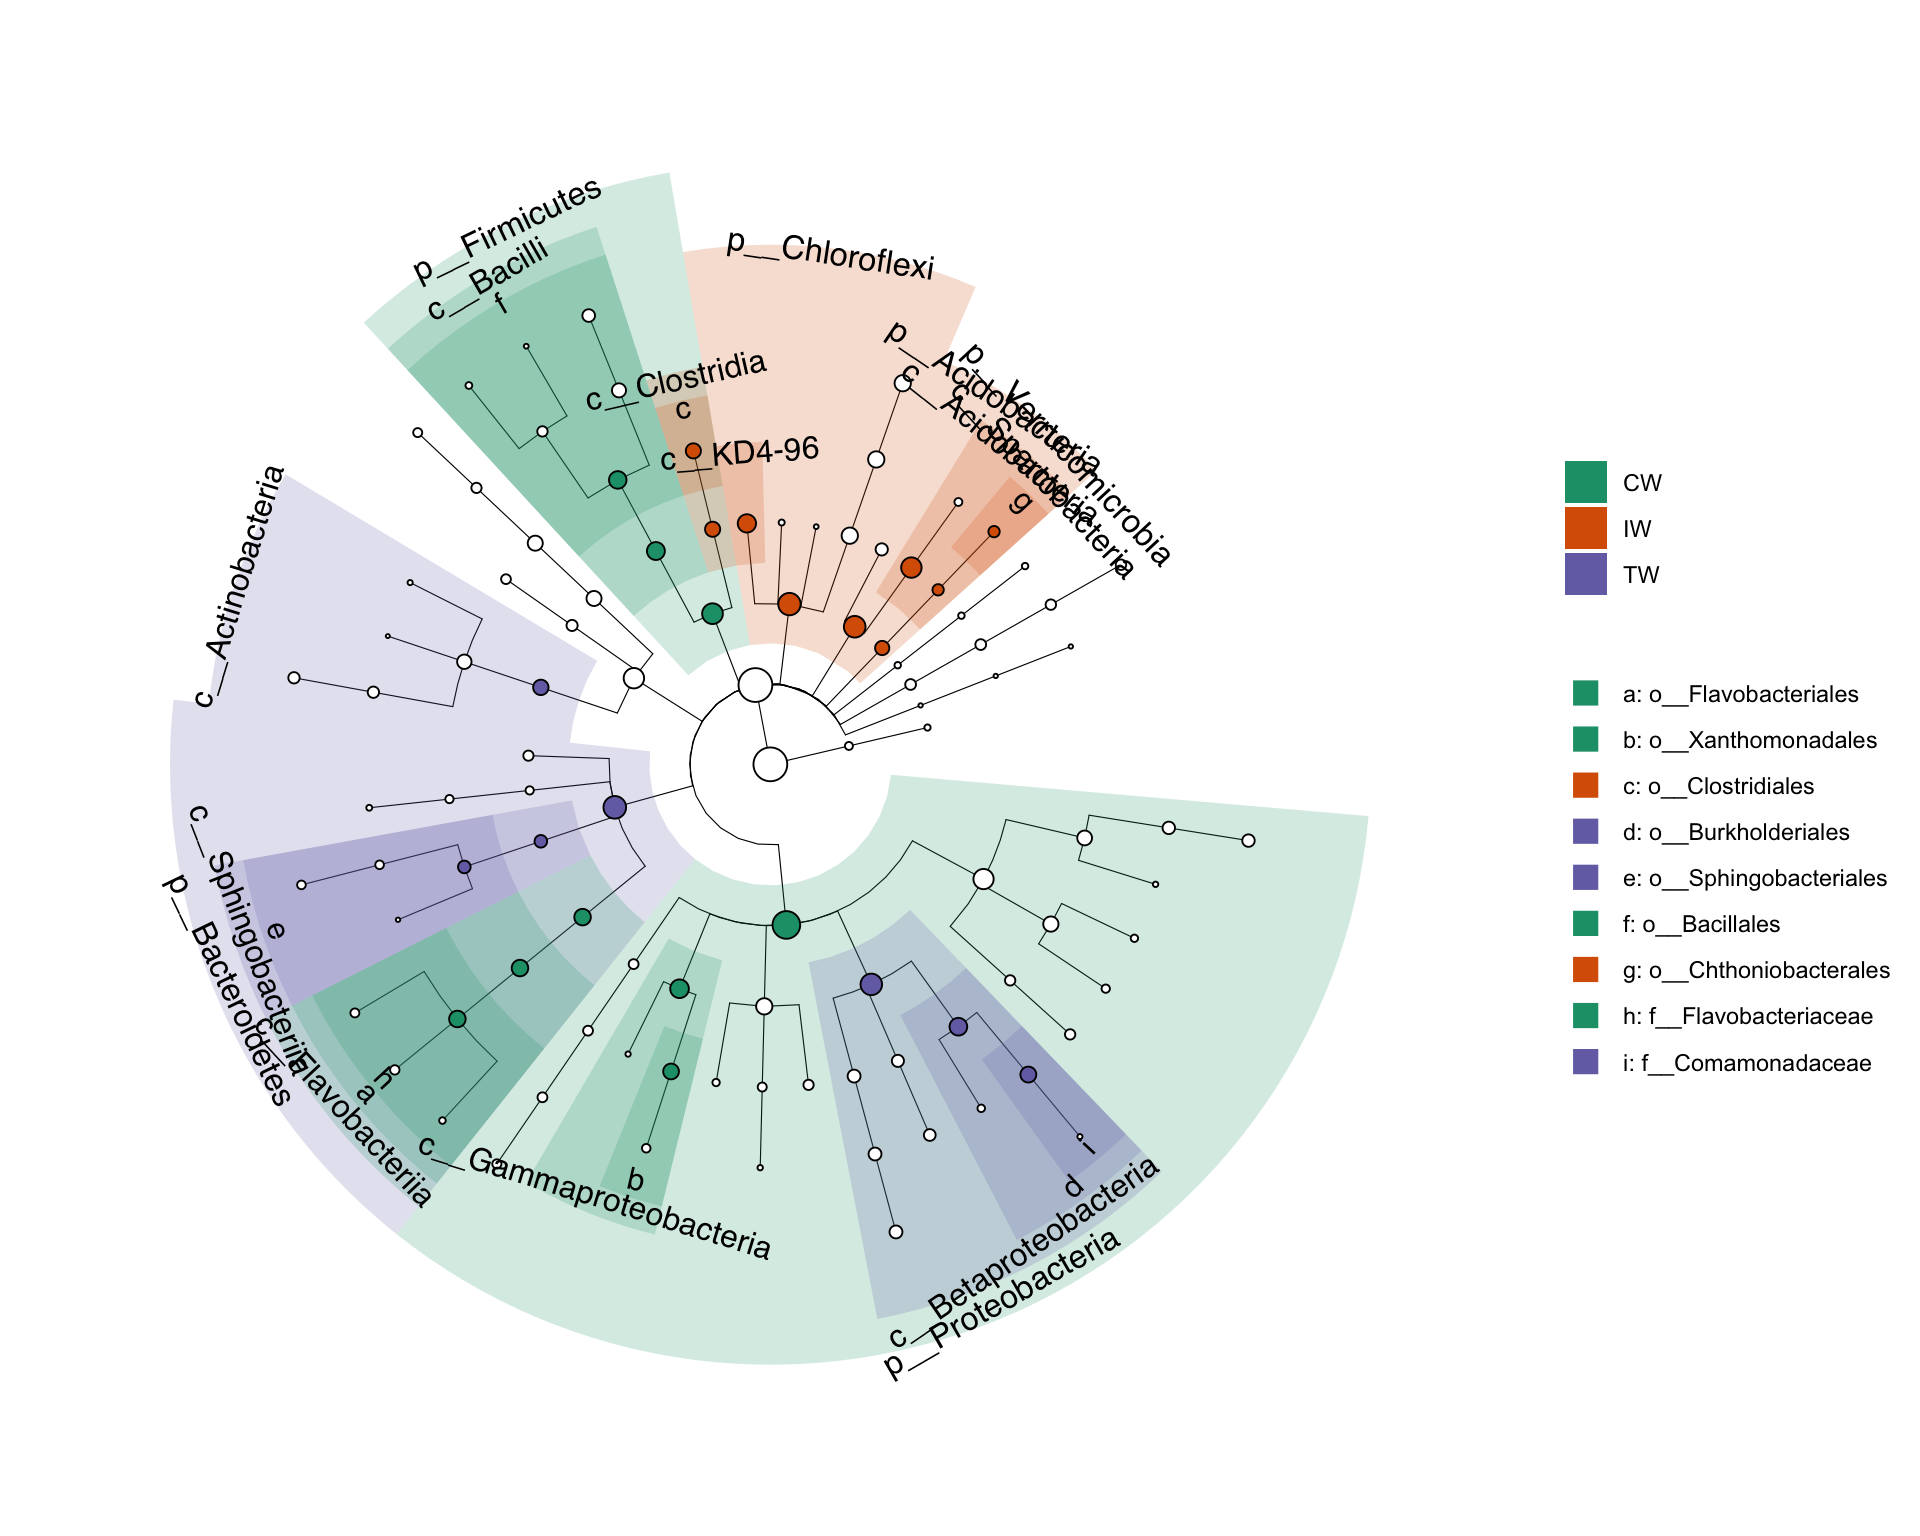
- LEfSe
- …
- Solan NCM
- Stegen (βNTI & RCbray-based)
- ST, NST, MST (stochasticity ratio)
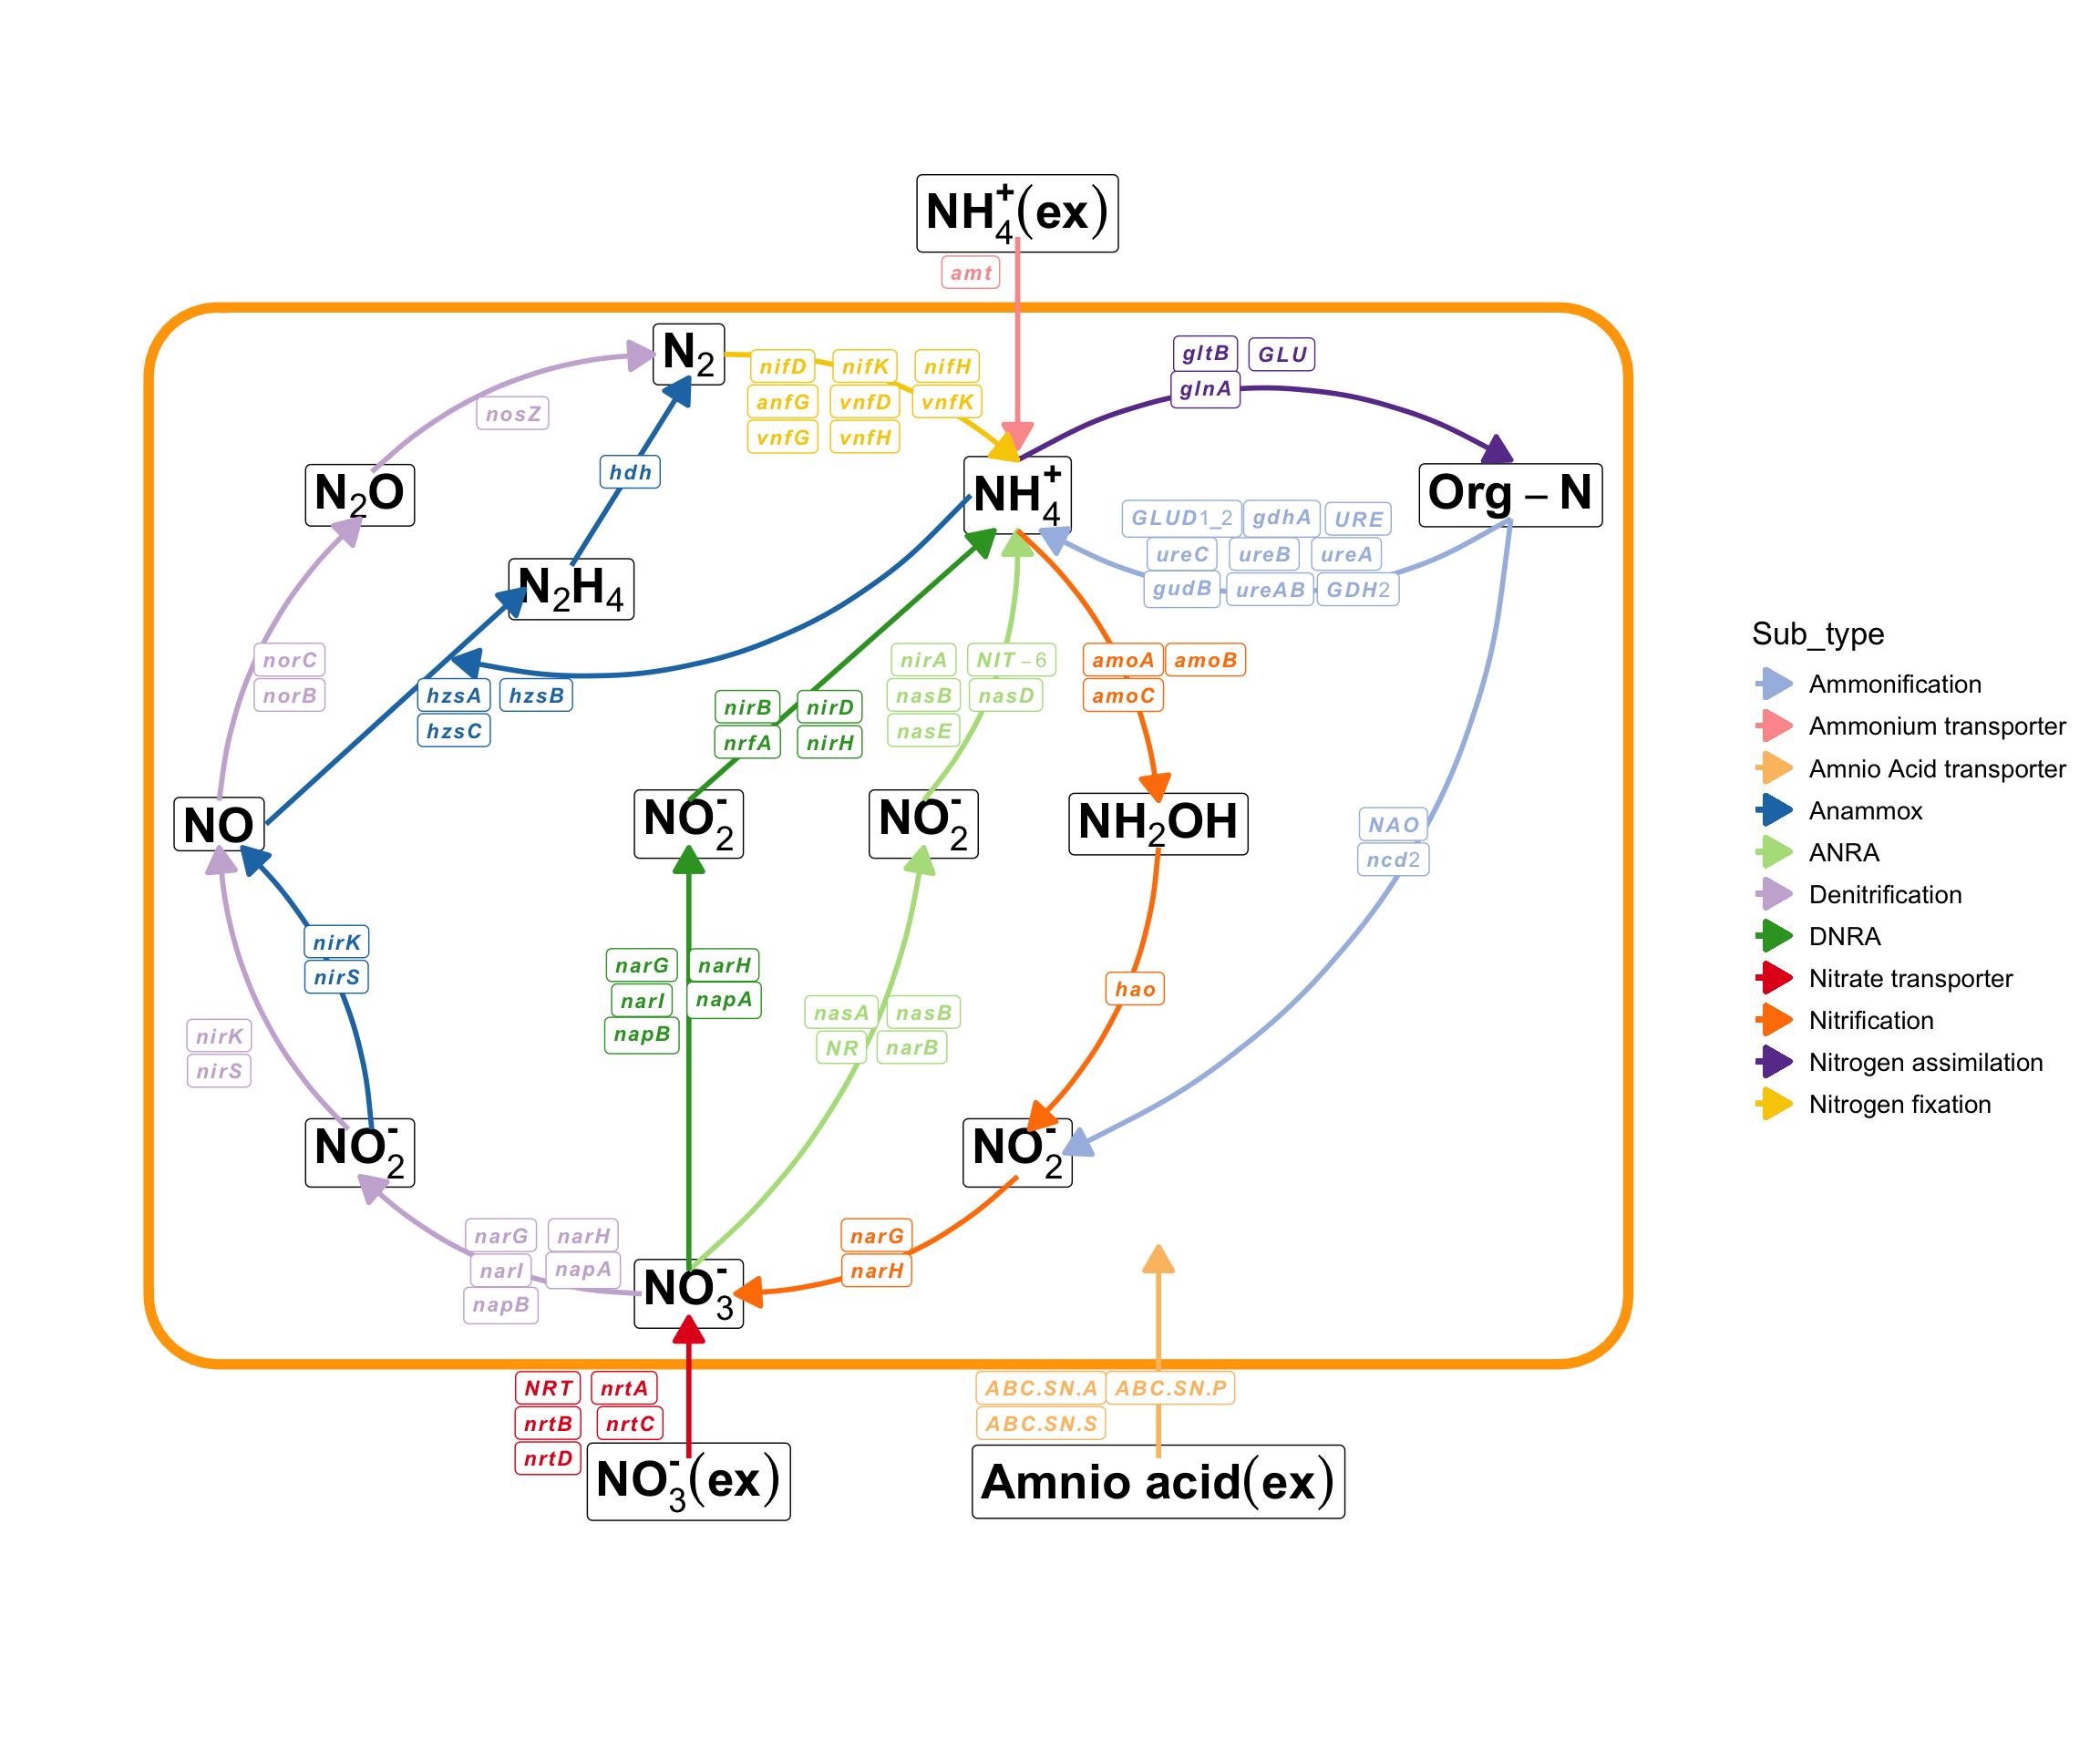
The pctax package includes some built-in cycling pathways, which enables users to conveniently visualize all genes or KO (KEGG Orthology) involved in these pathways.
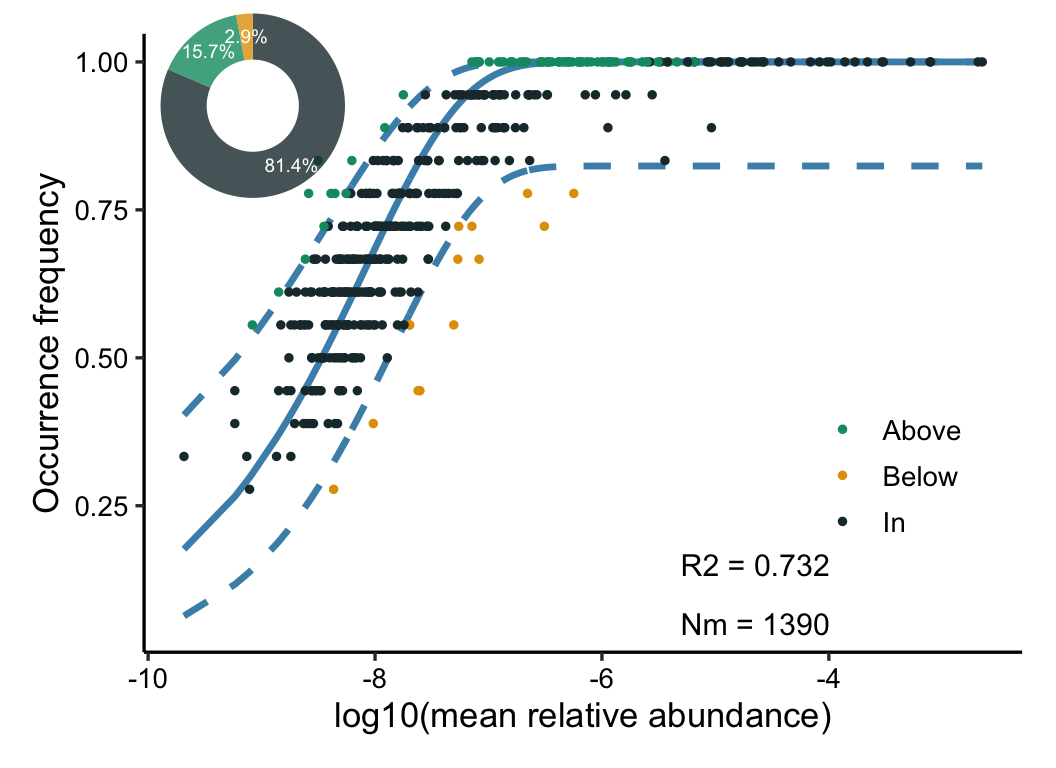
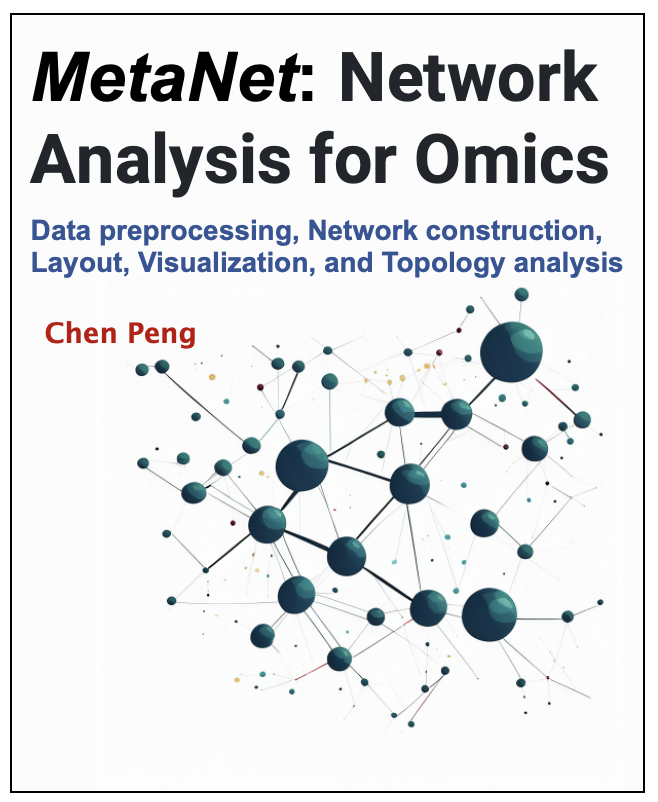
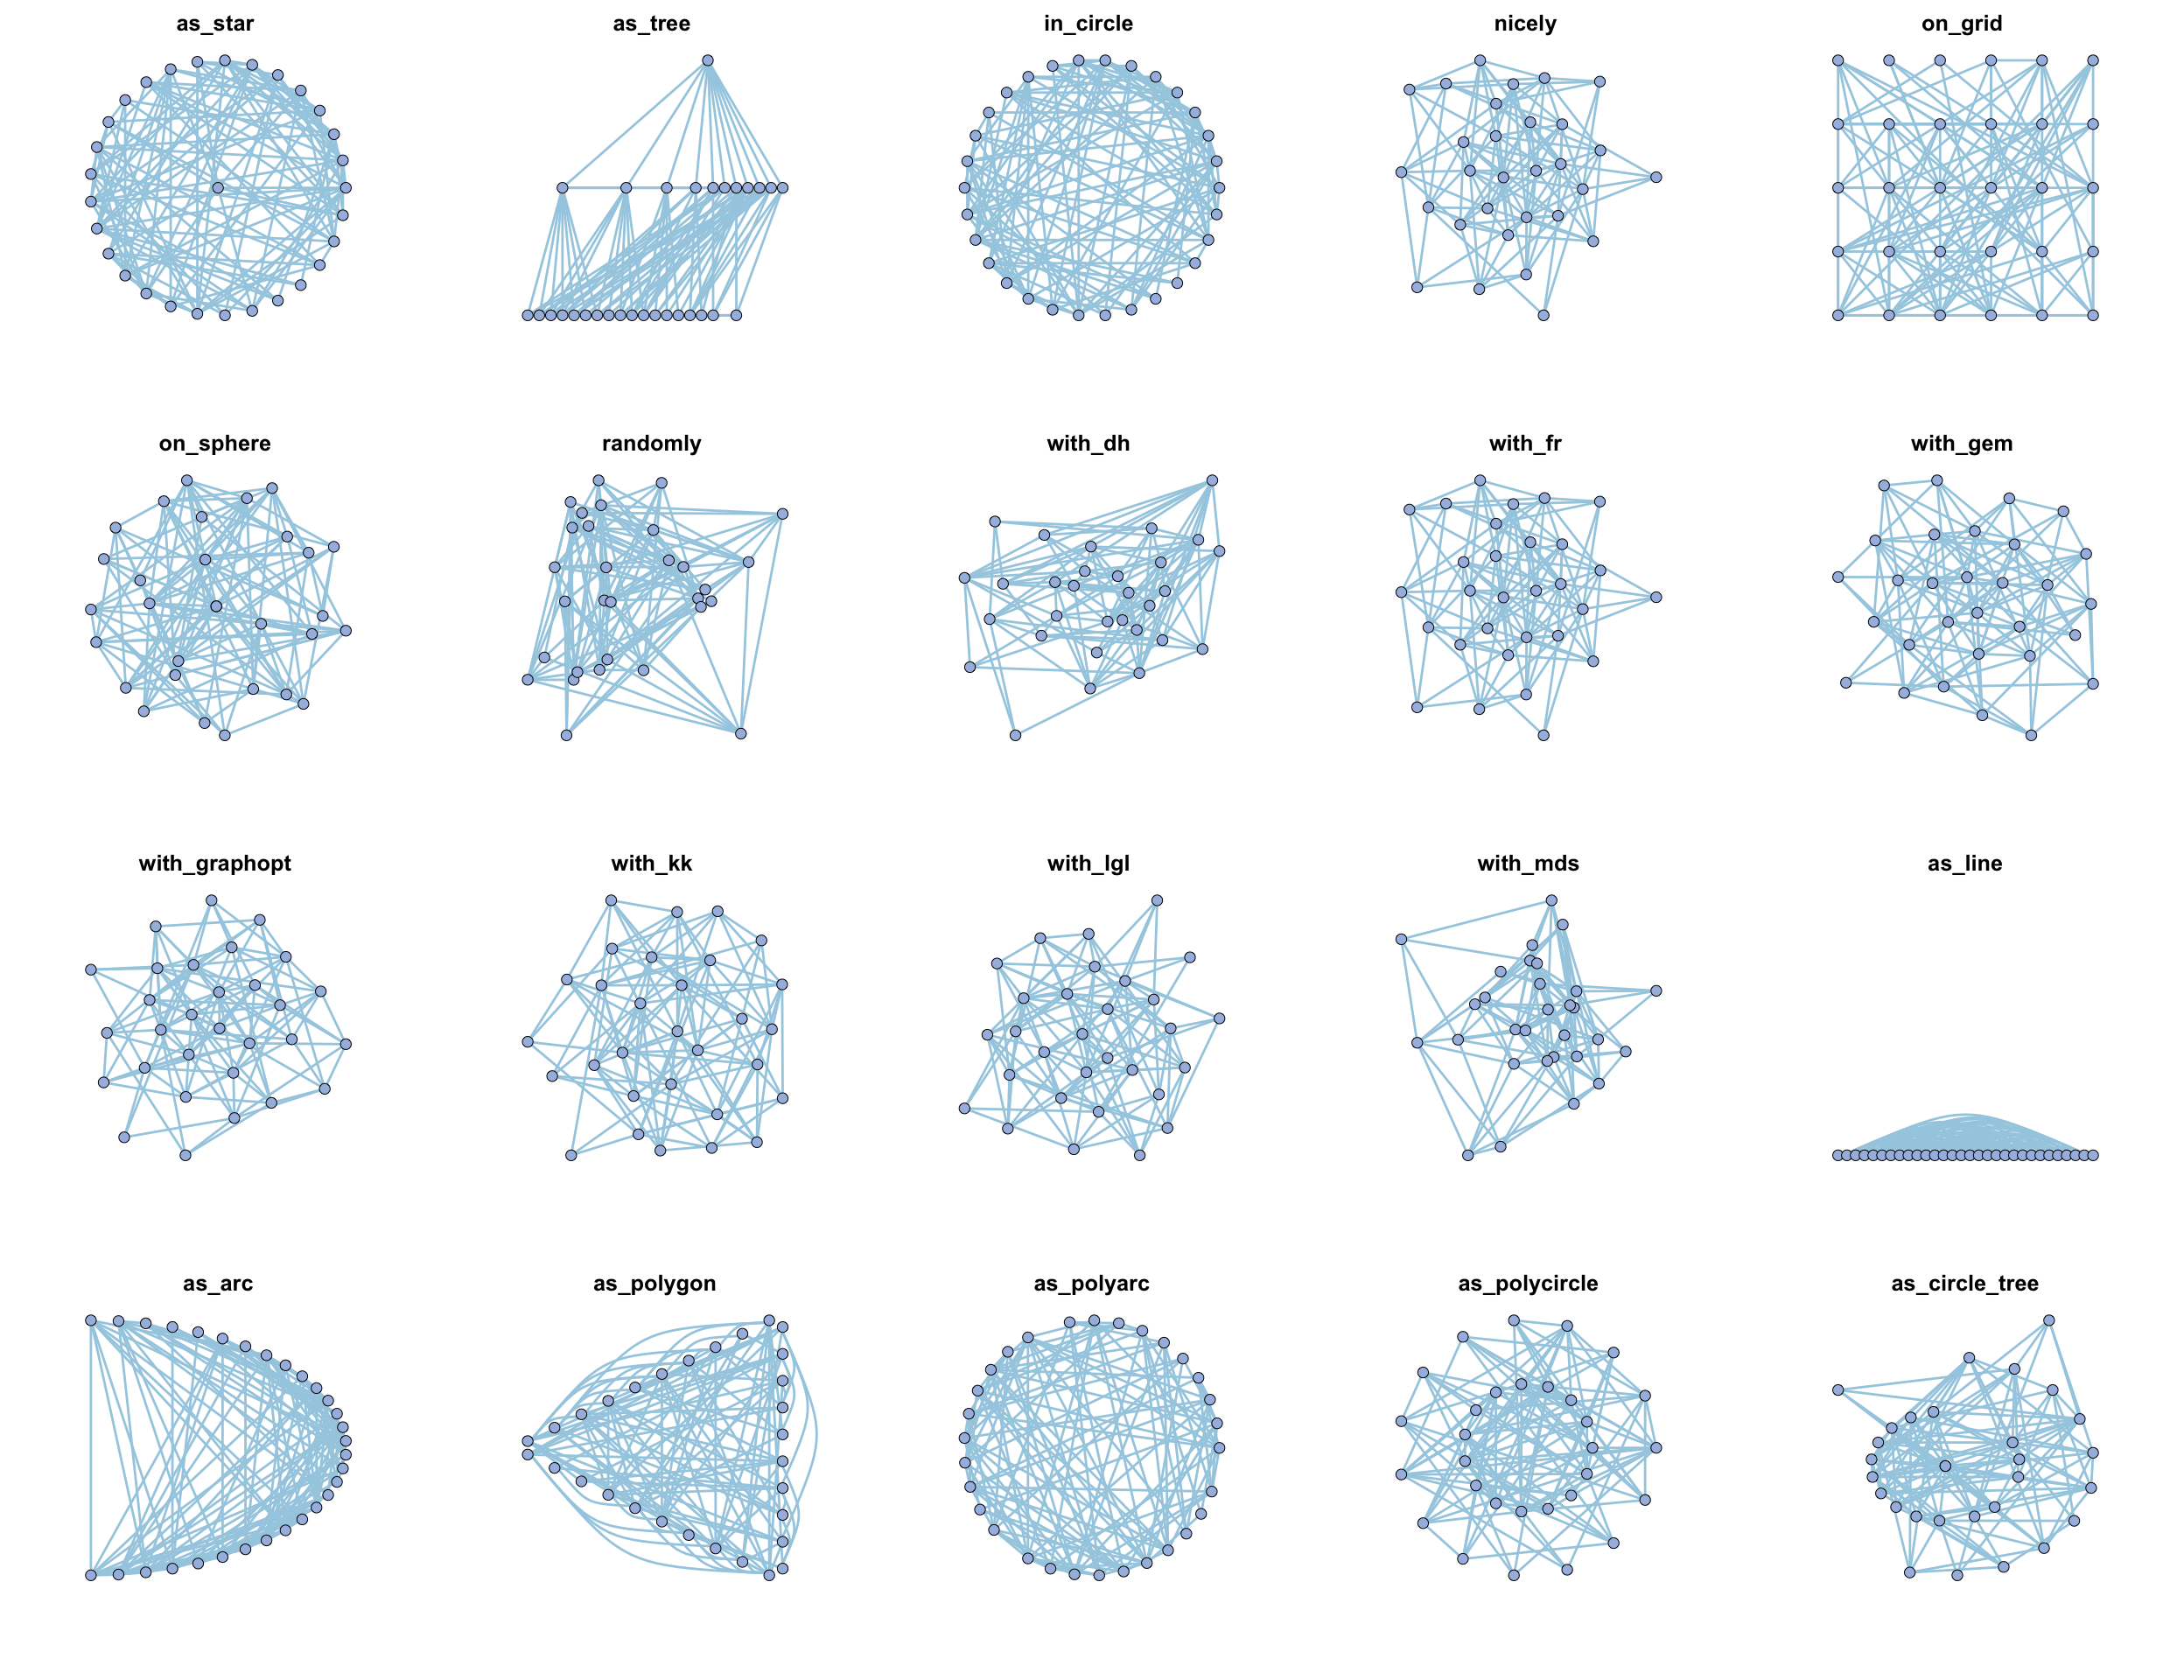
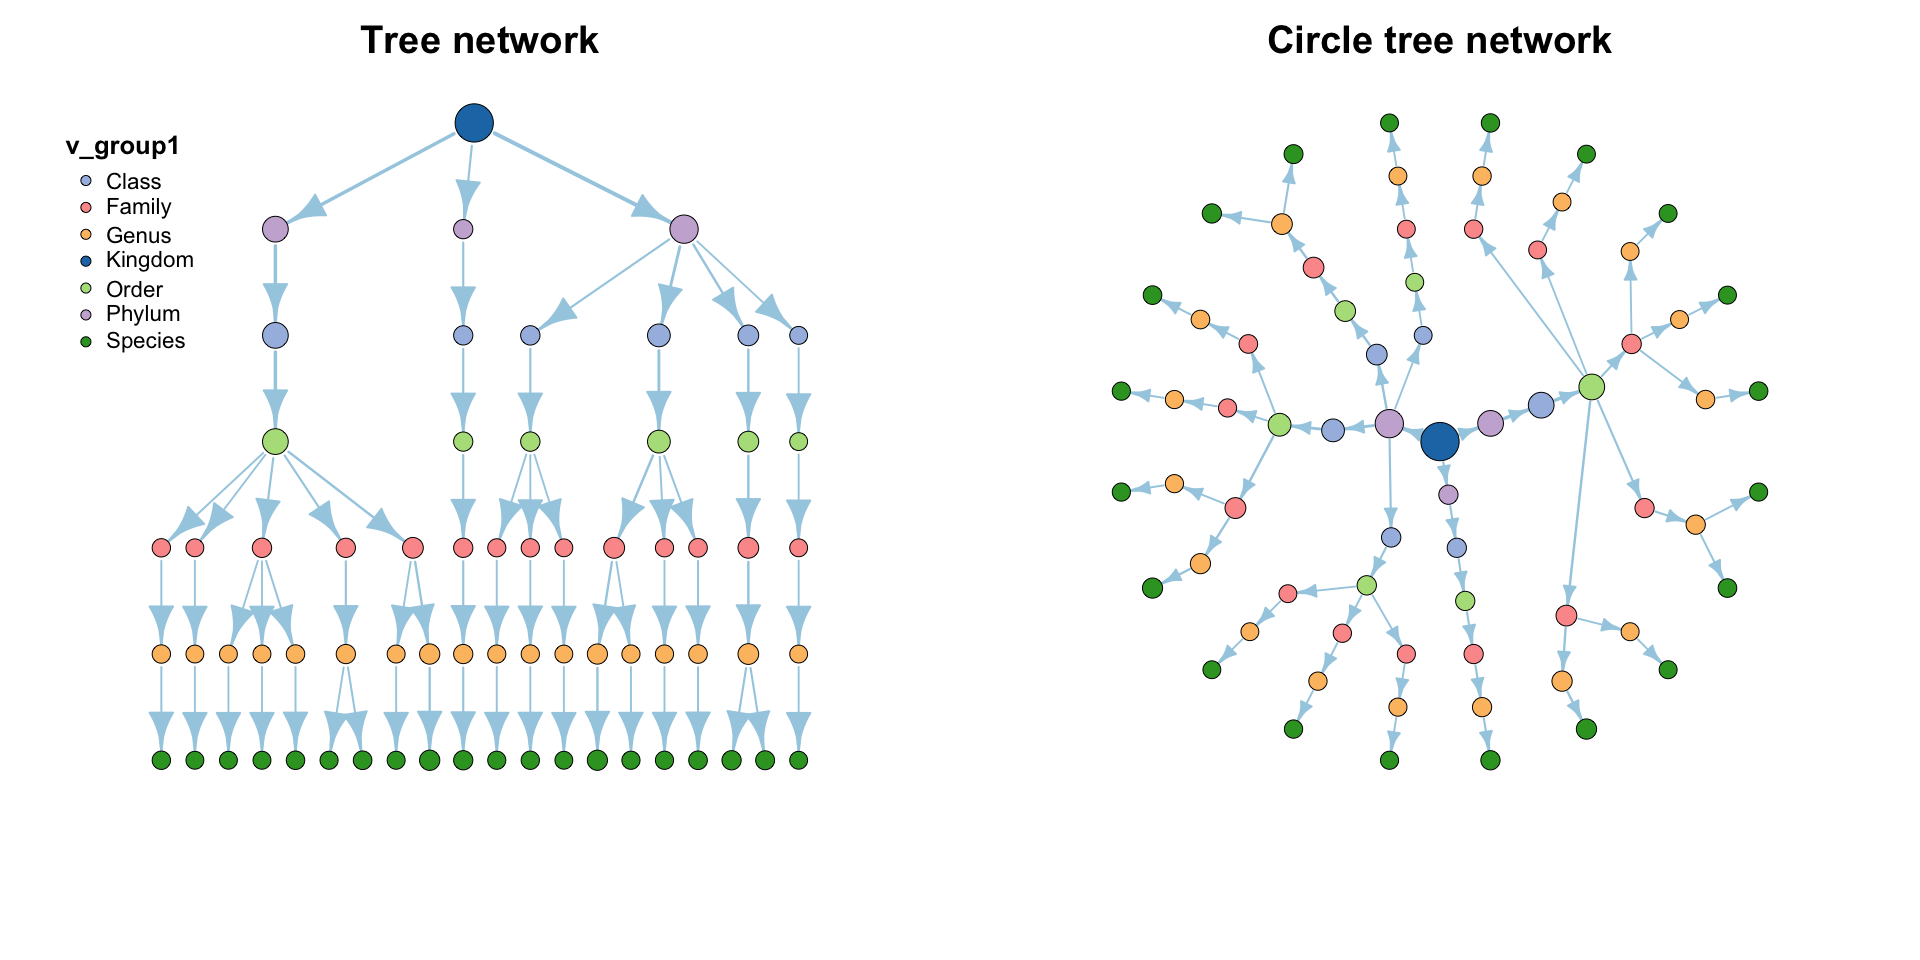
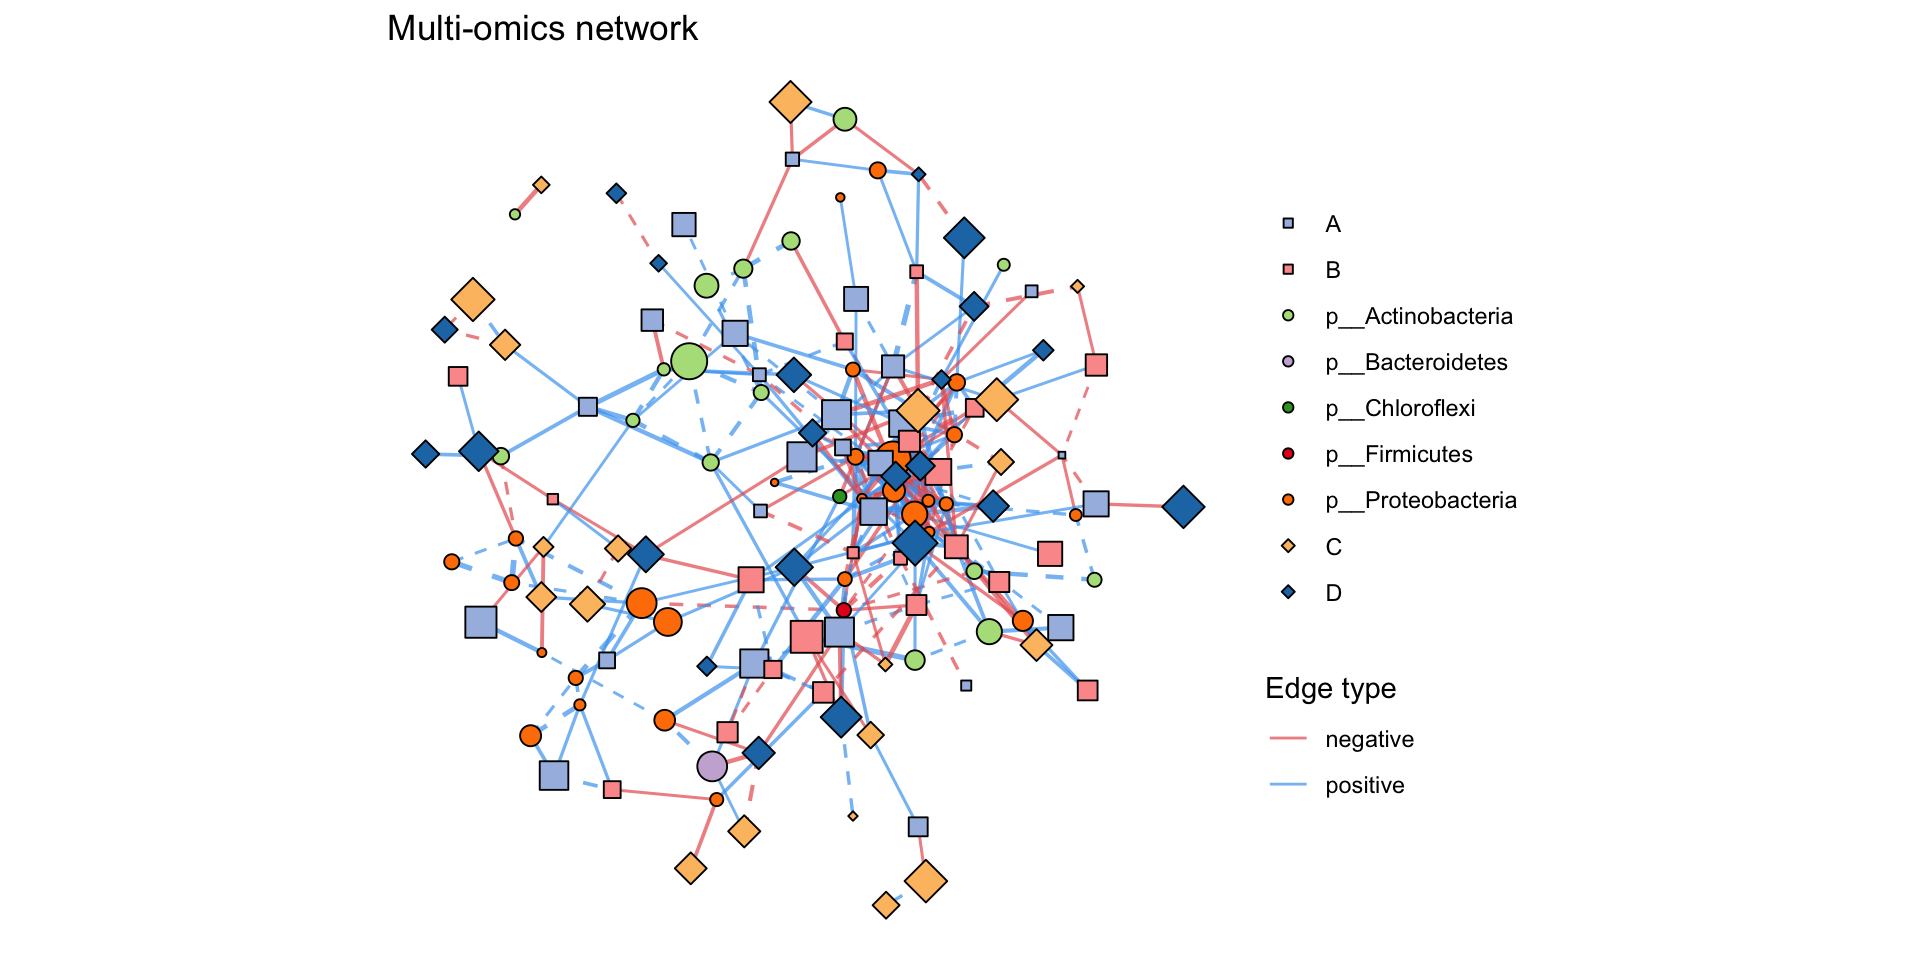
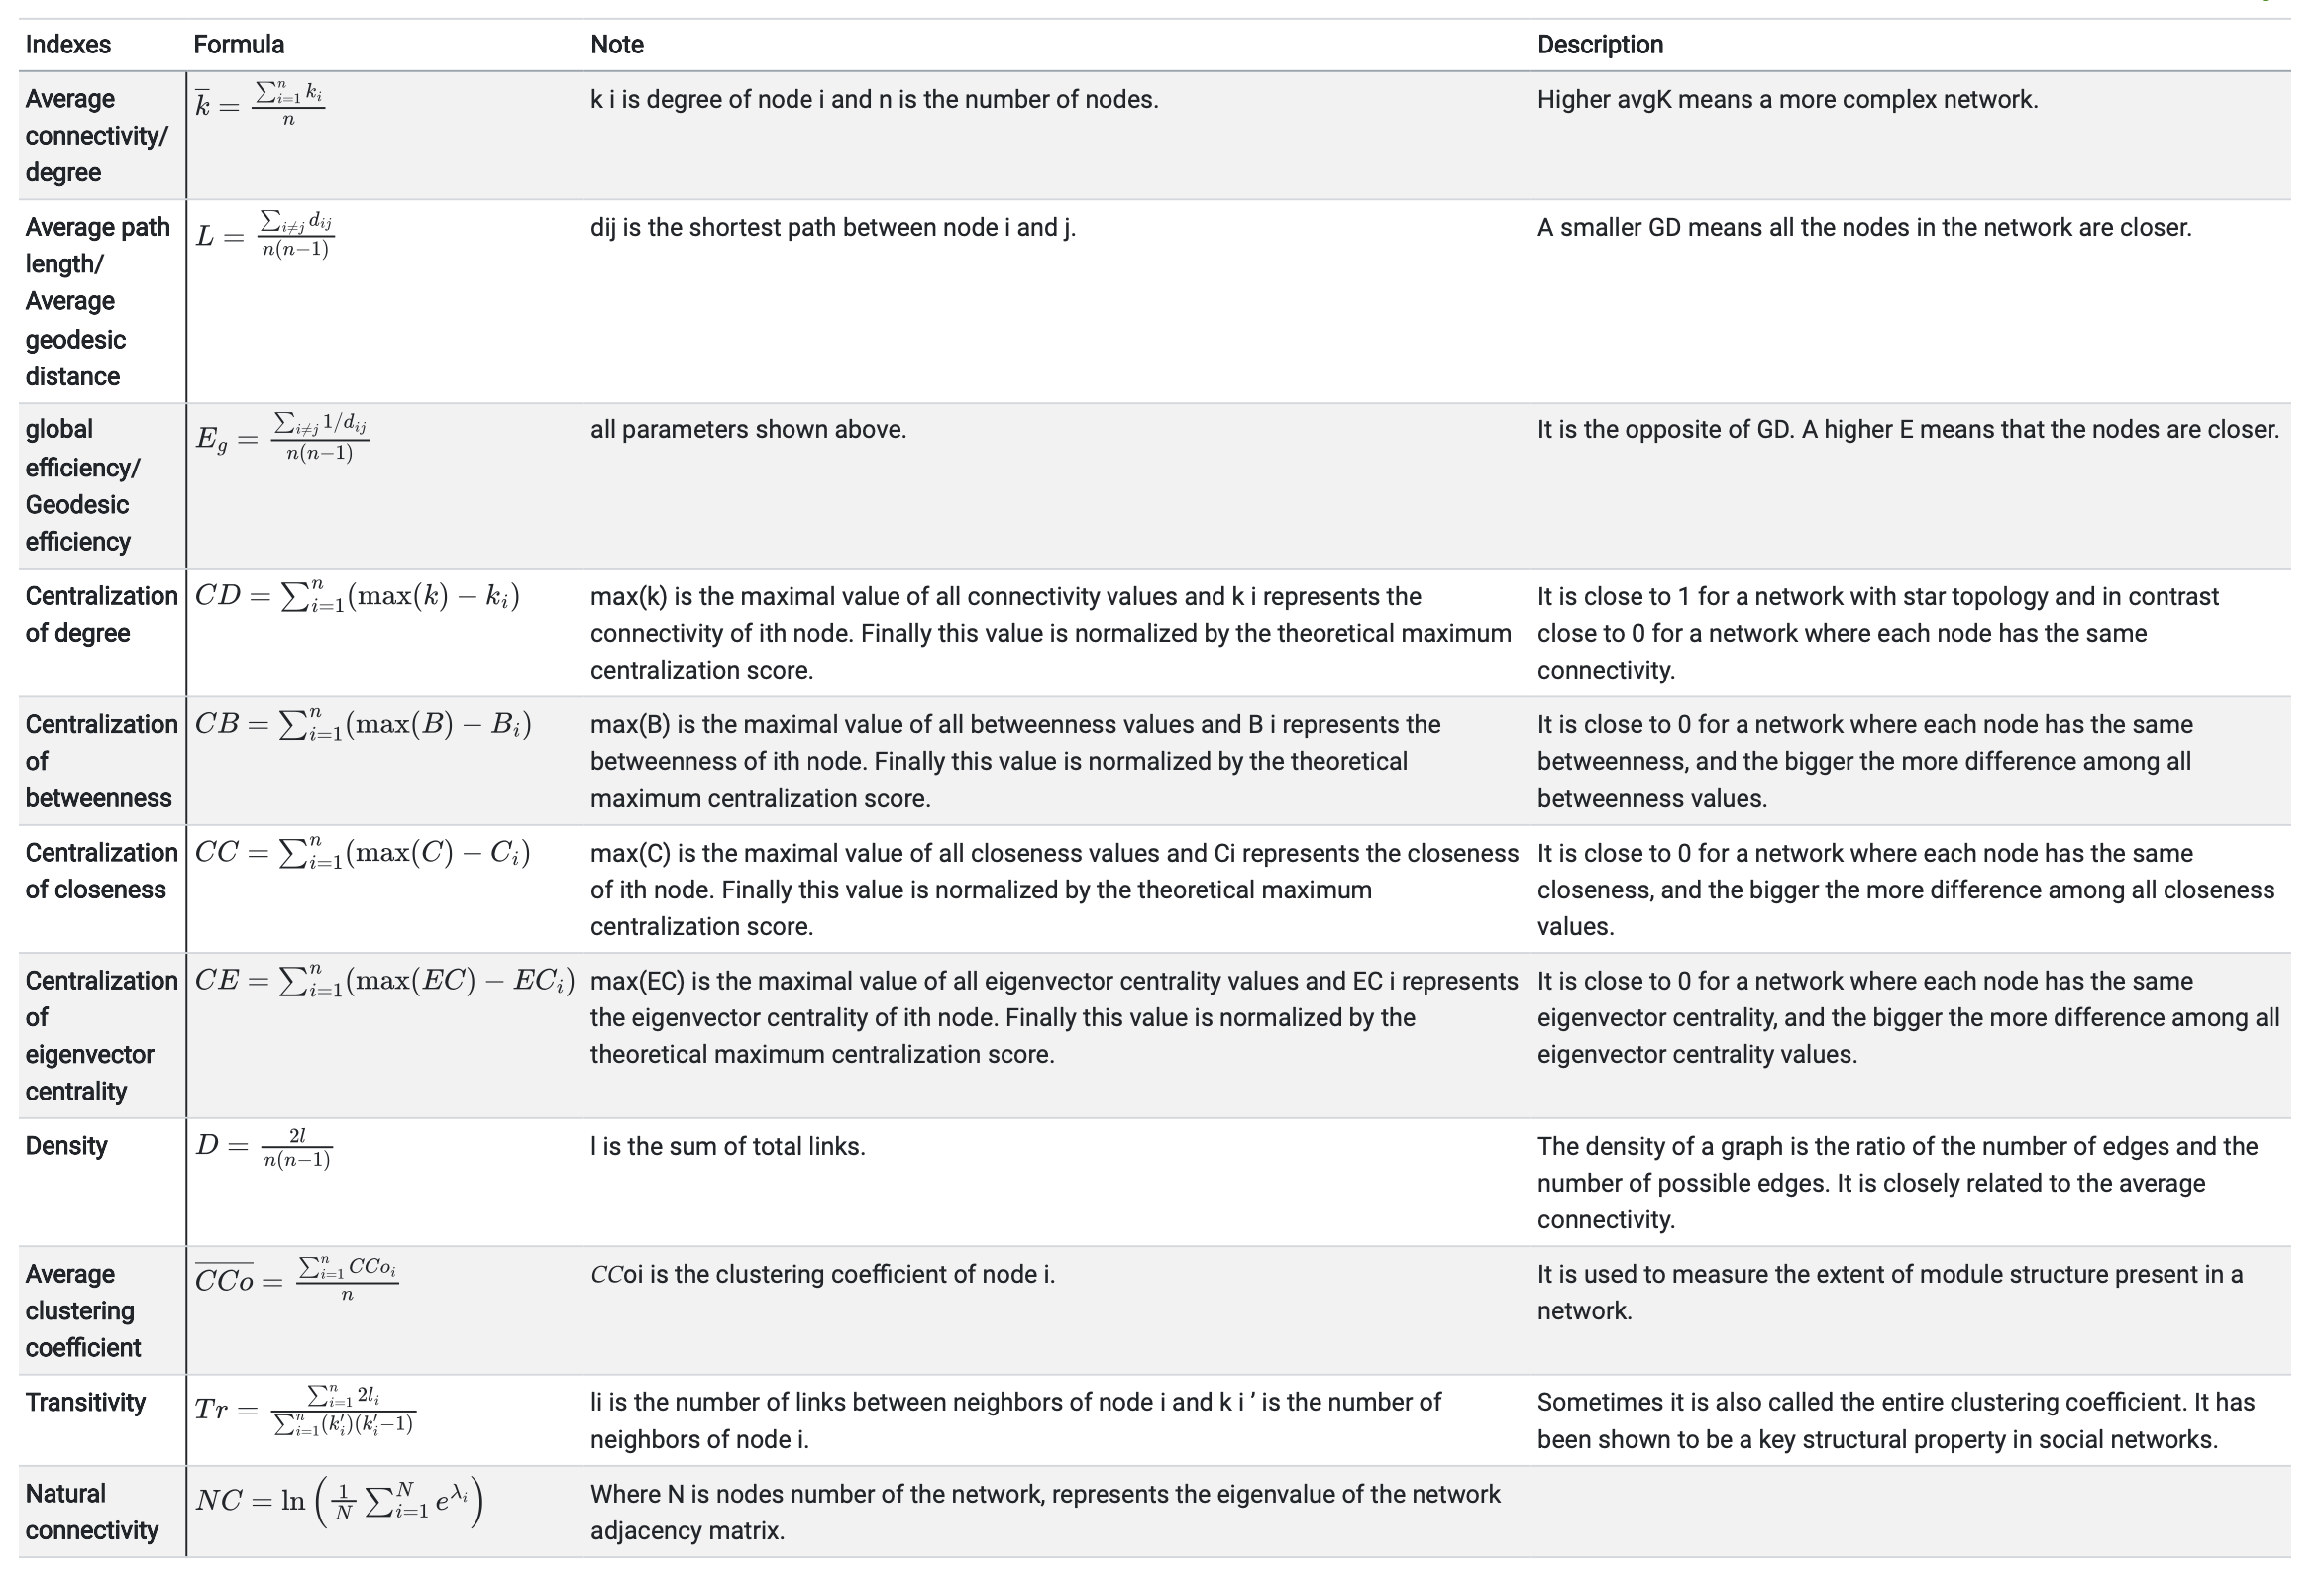
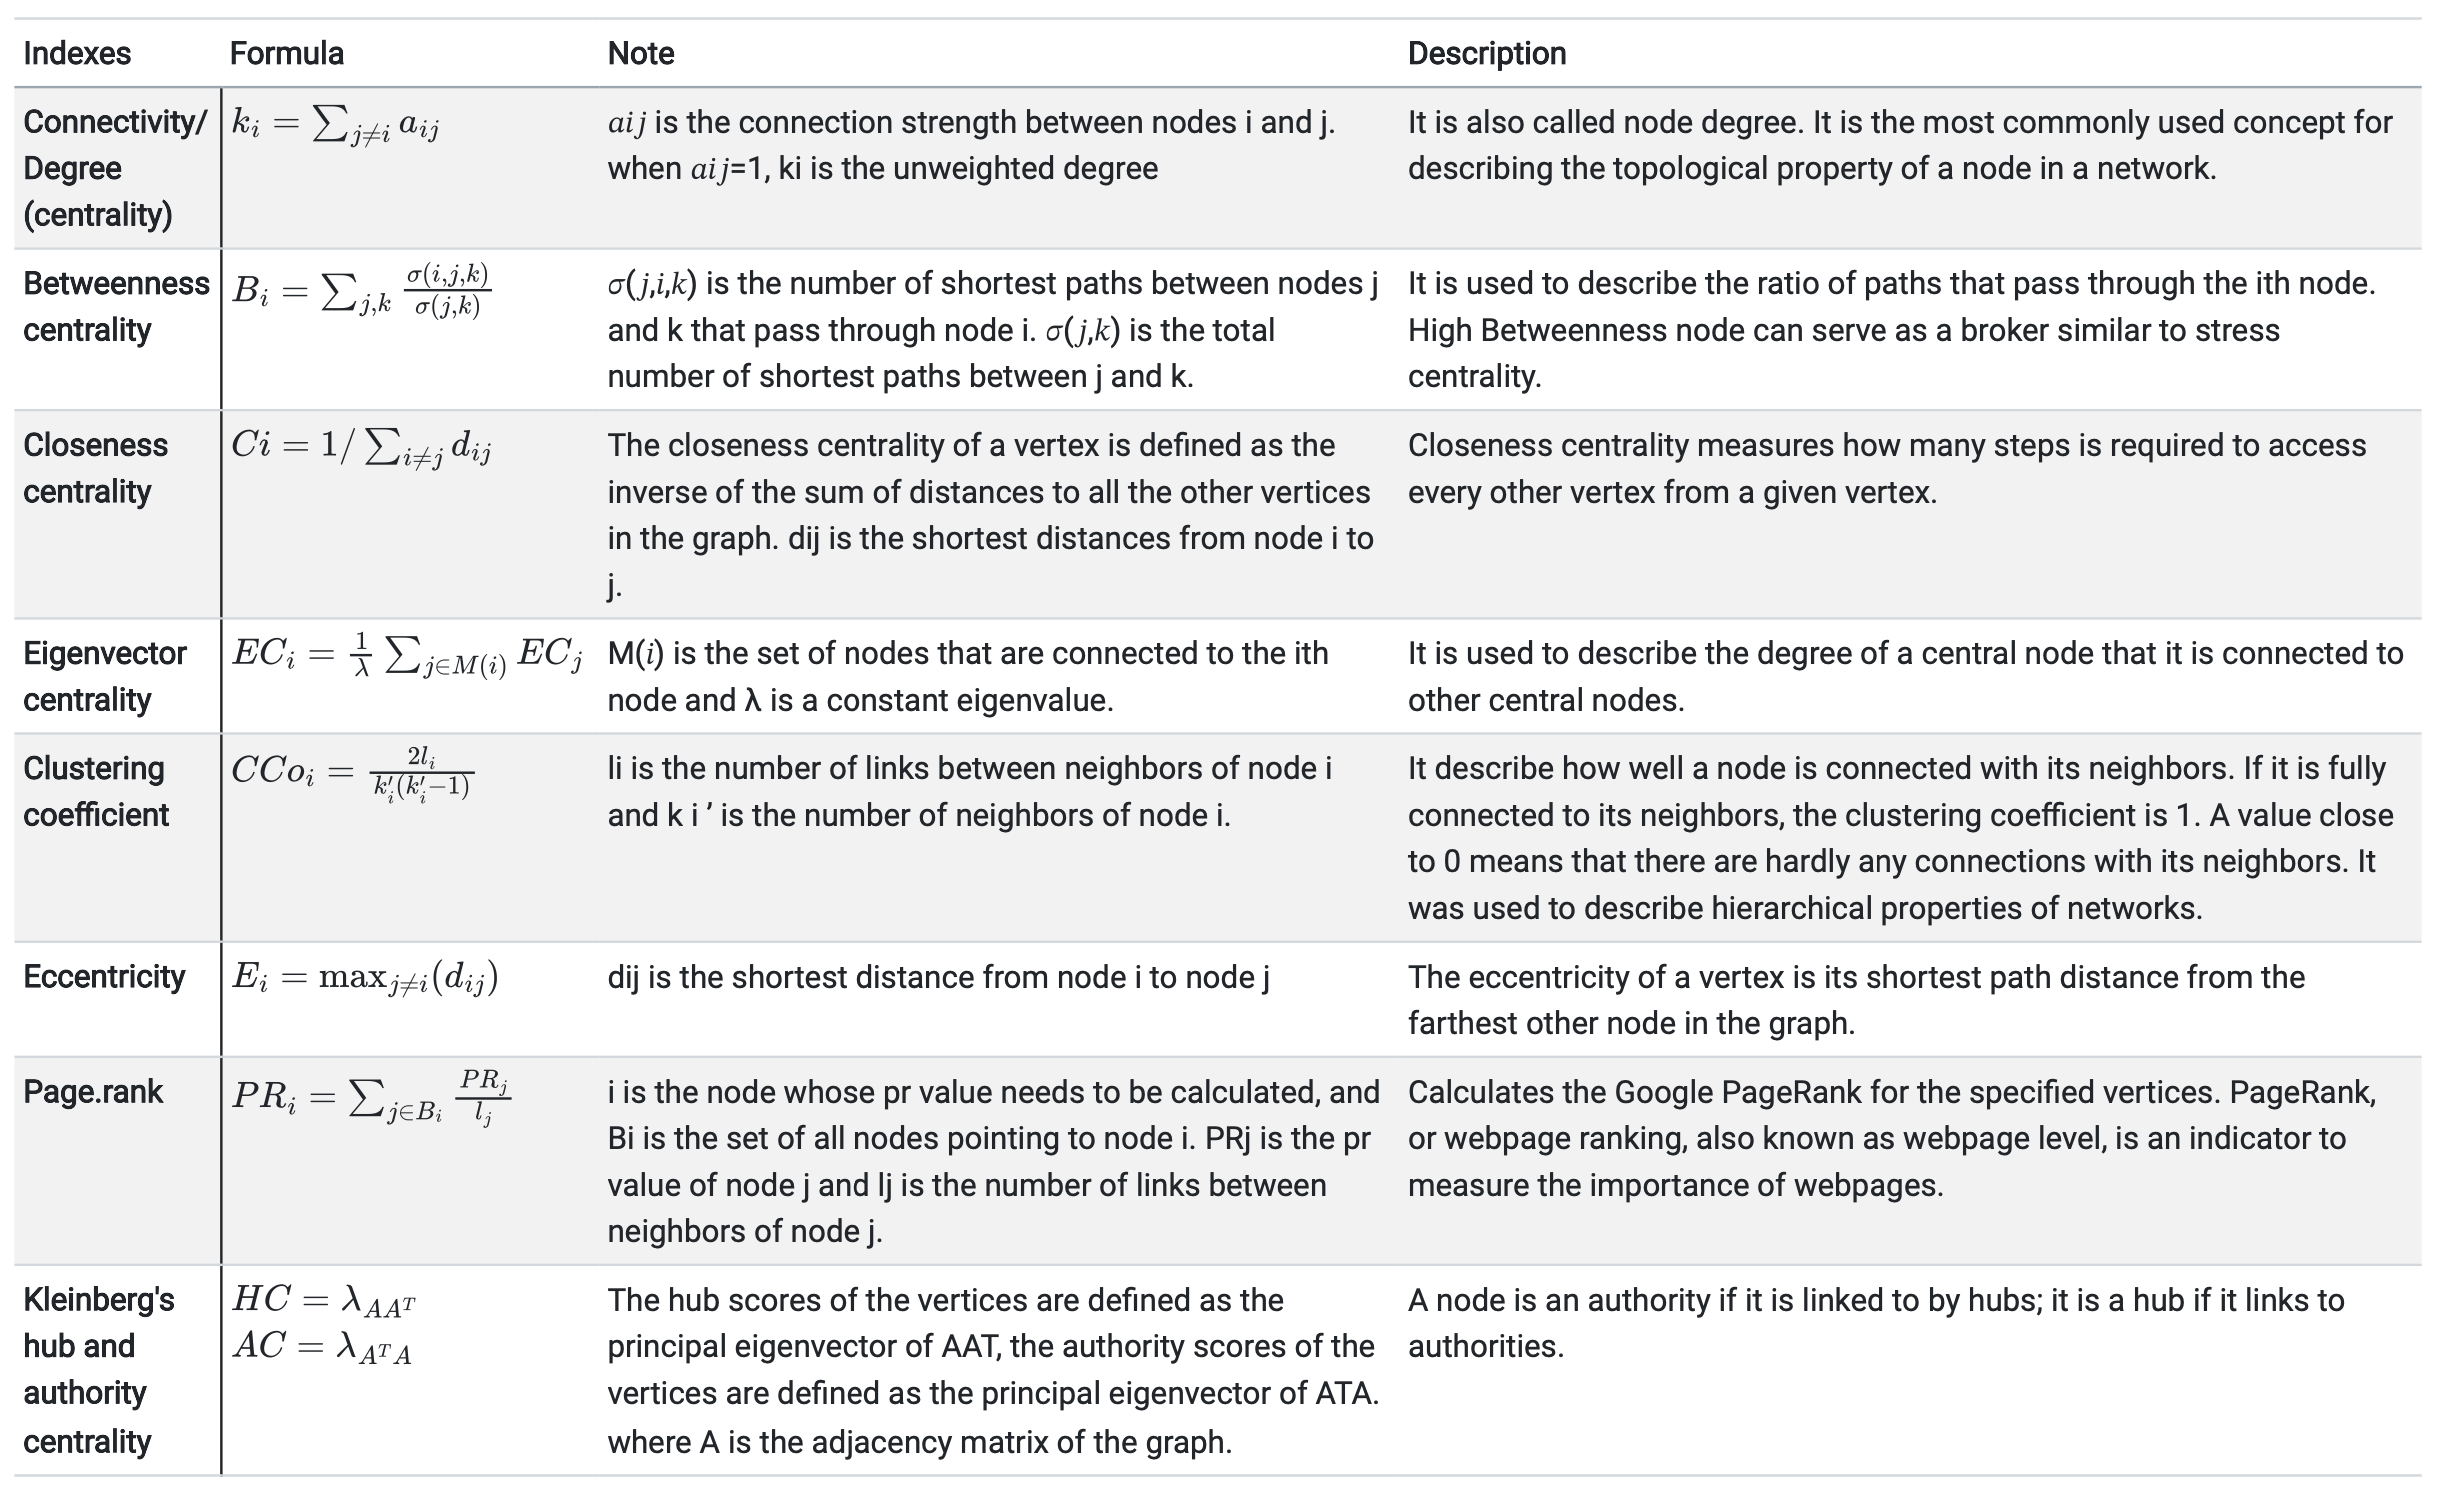
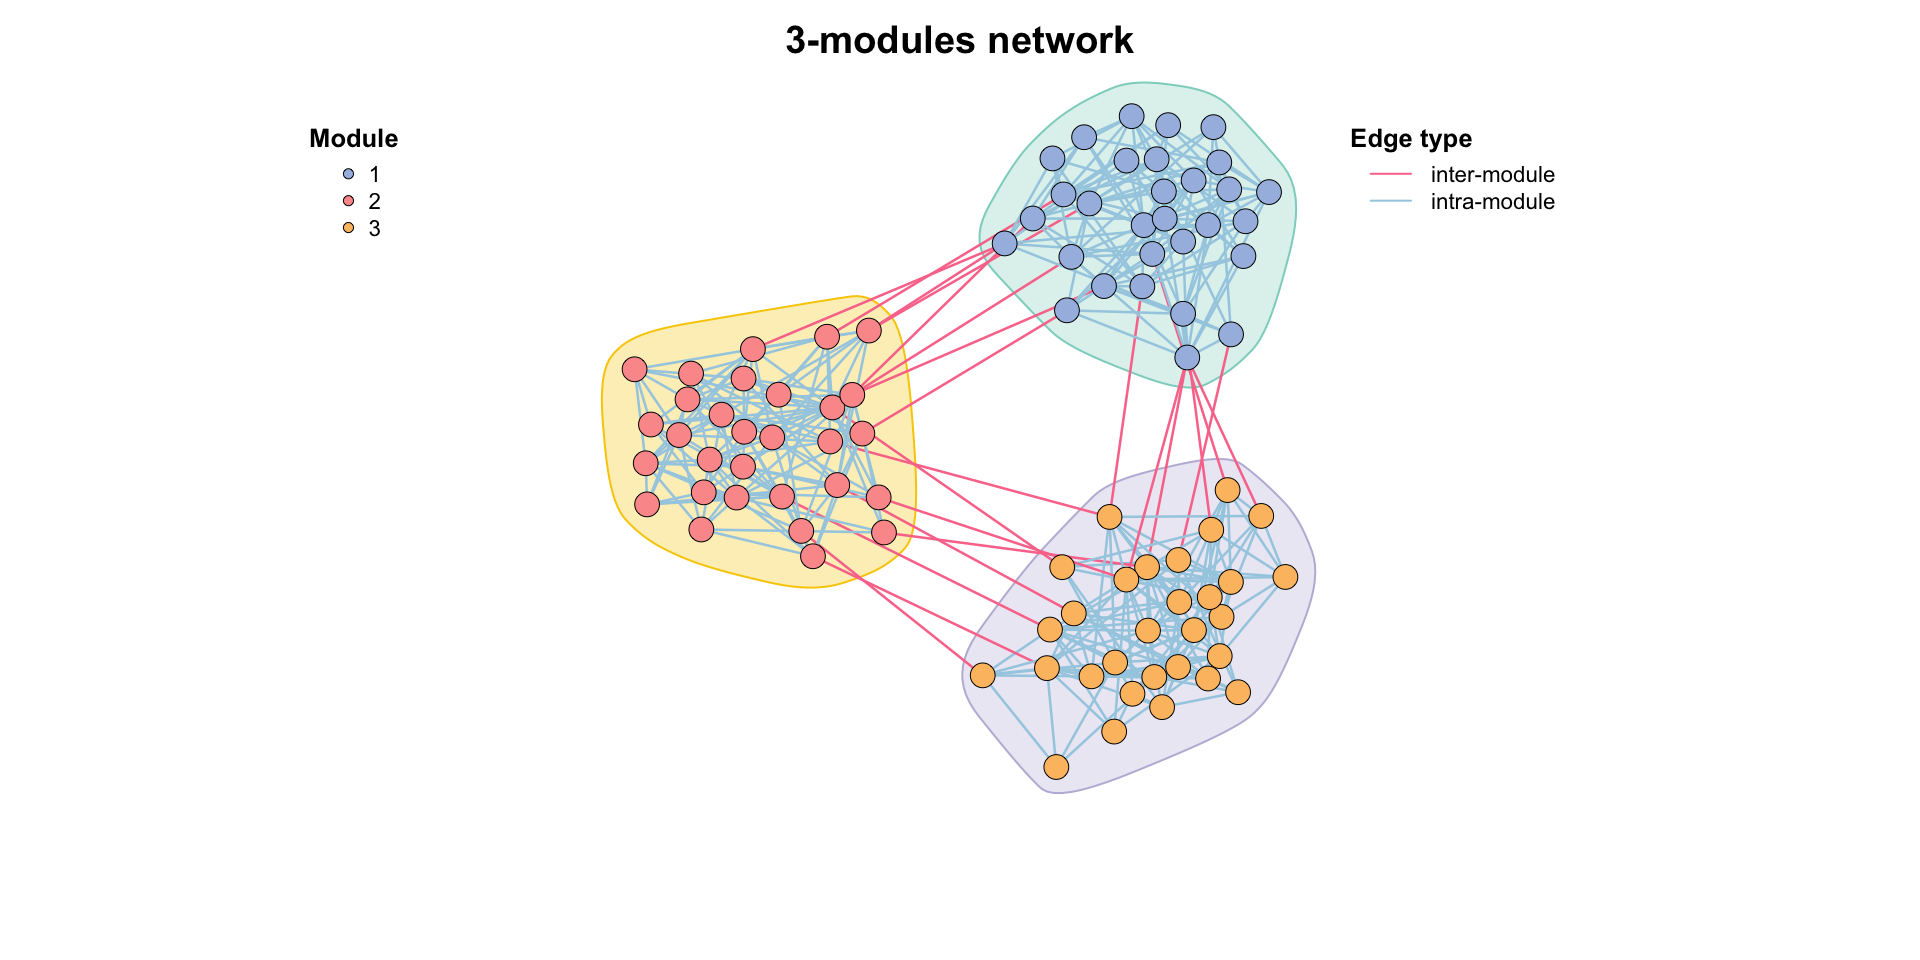
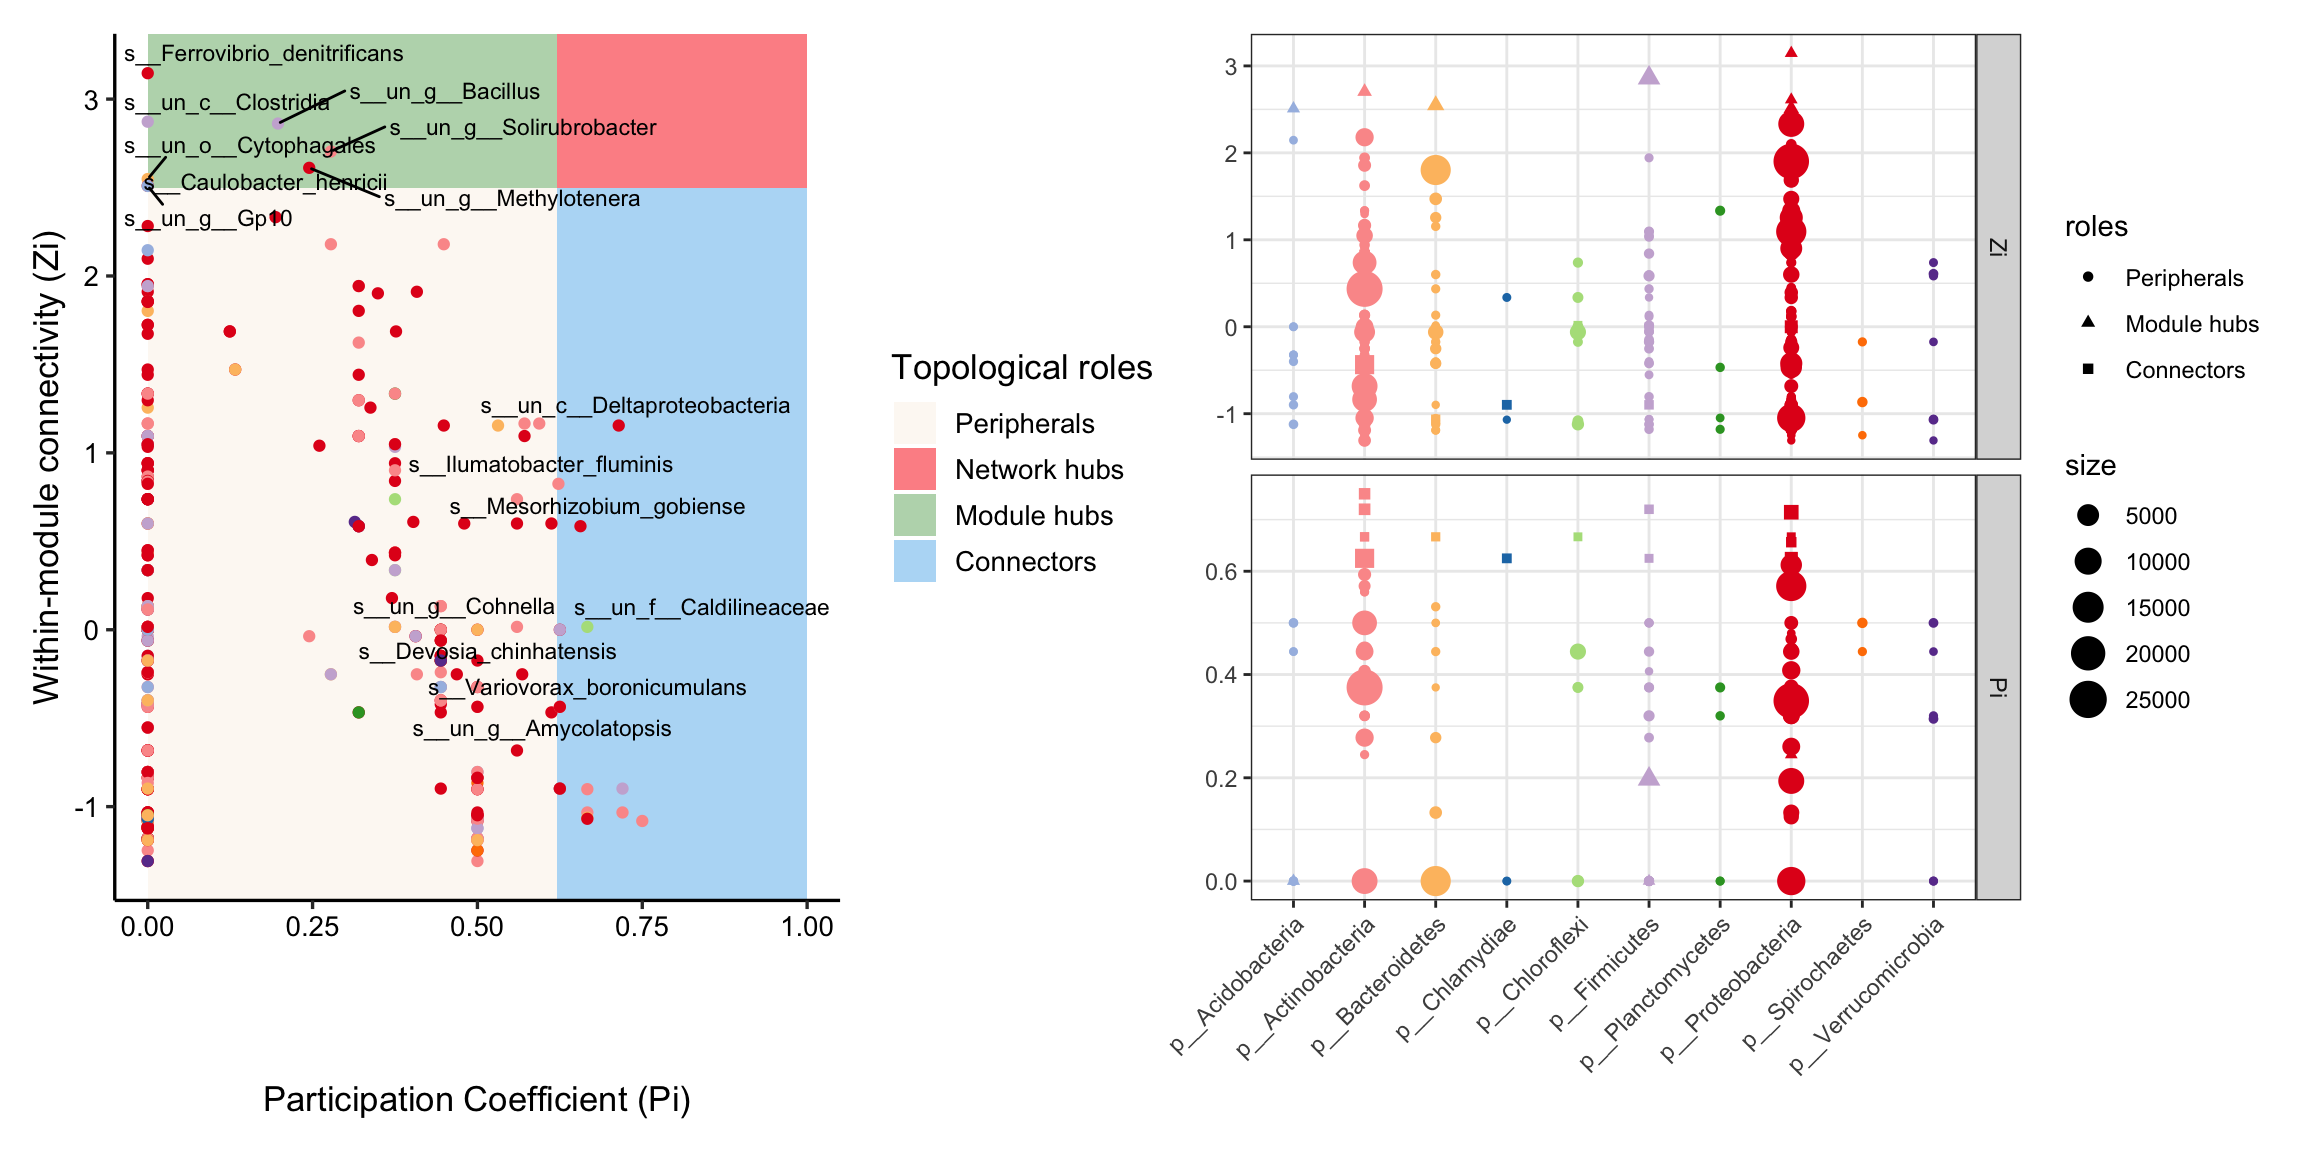
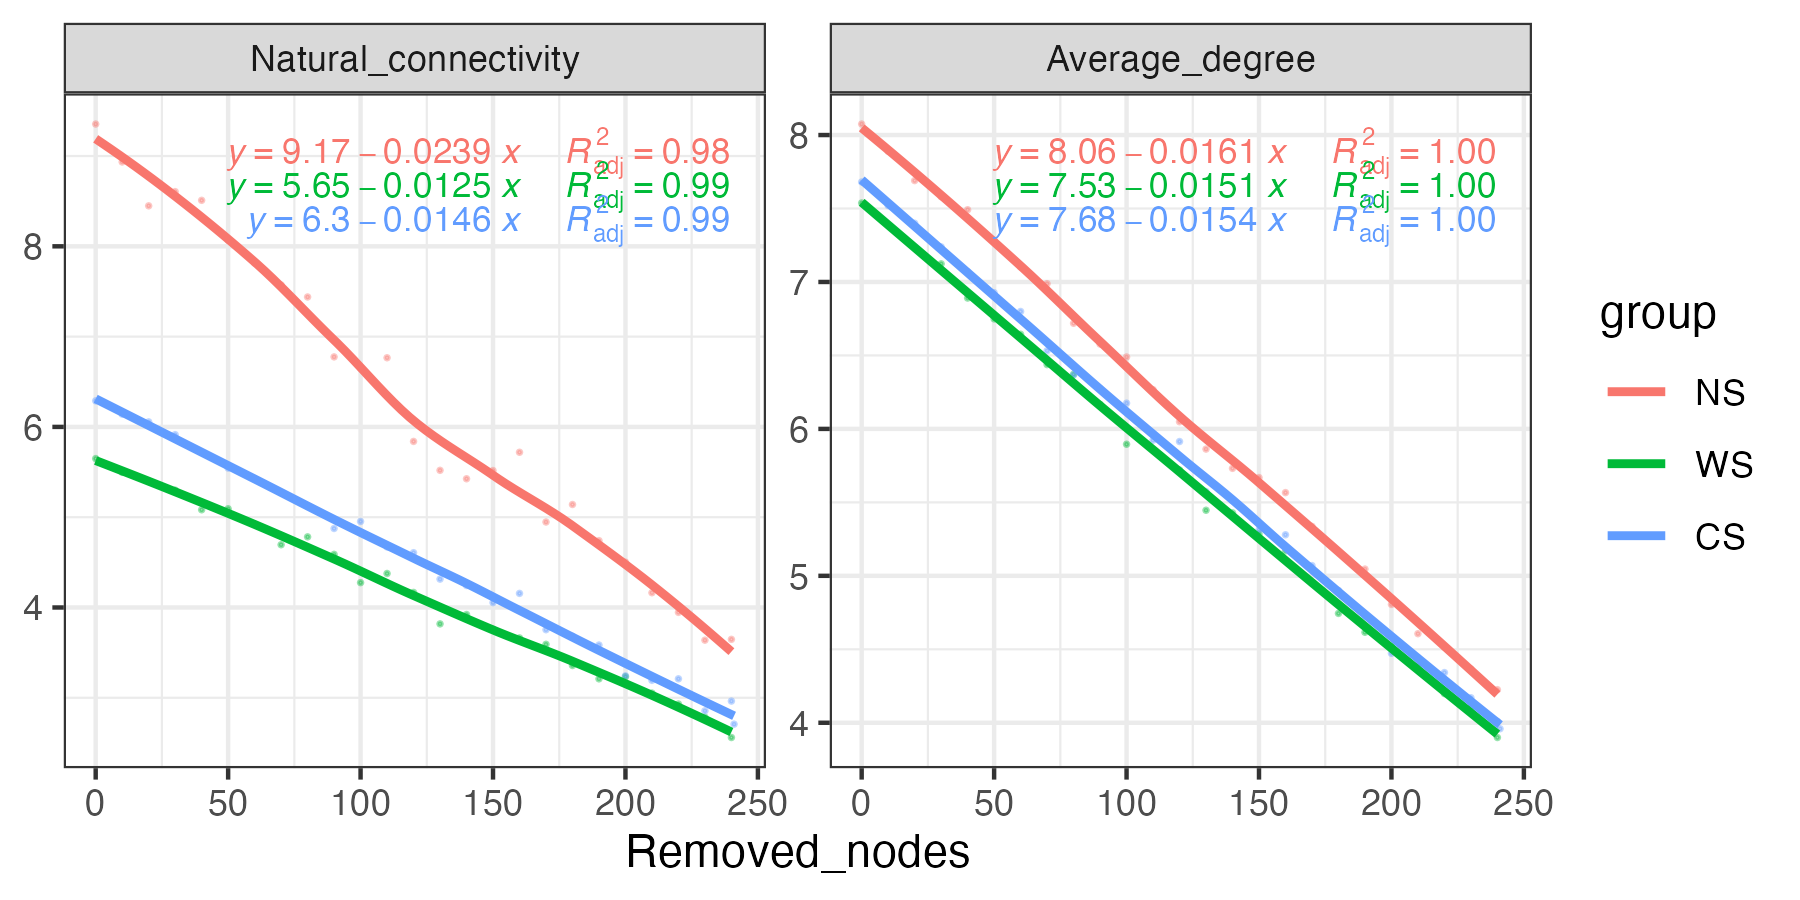
MetaNet 
- It is a comprehensive network analysis package for omics data.
- See the MetaNet Tutorial

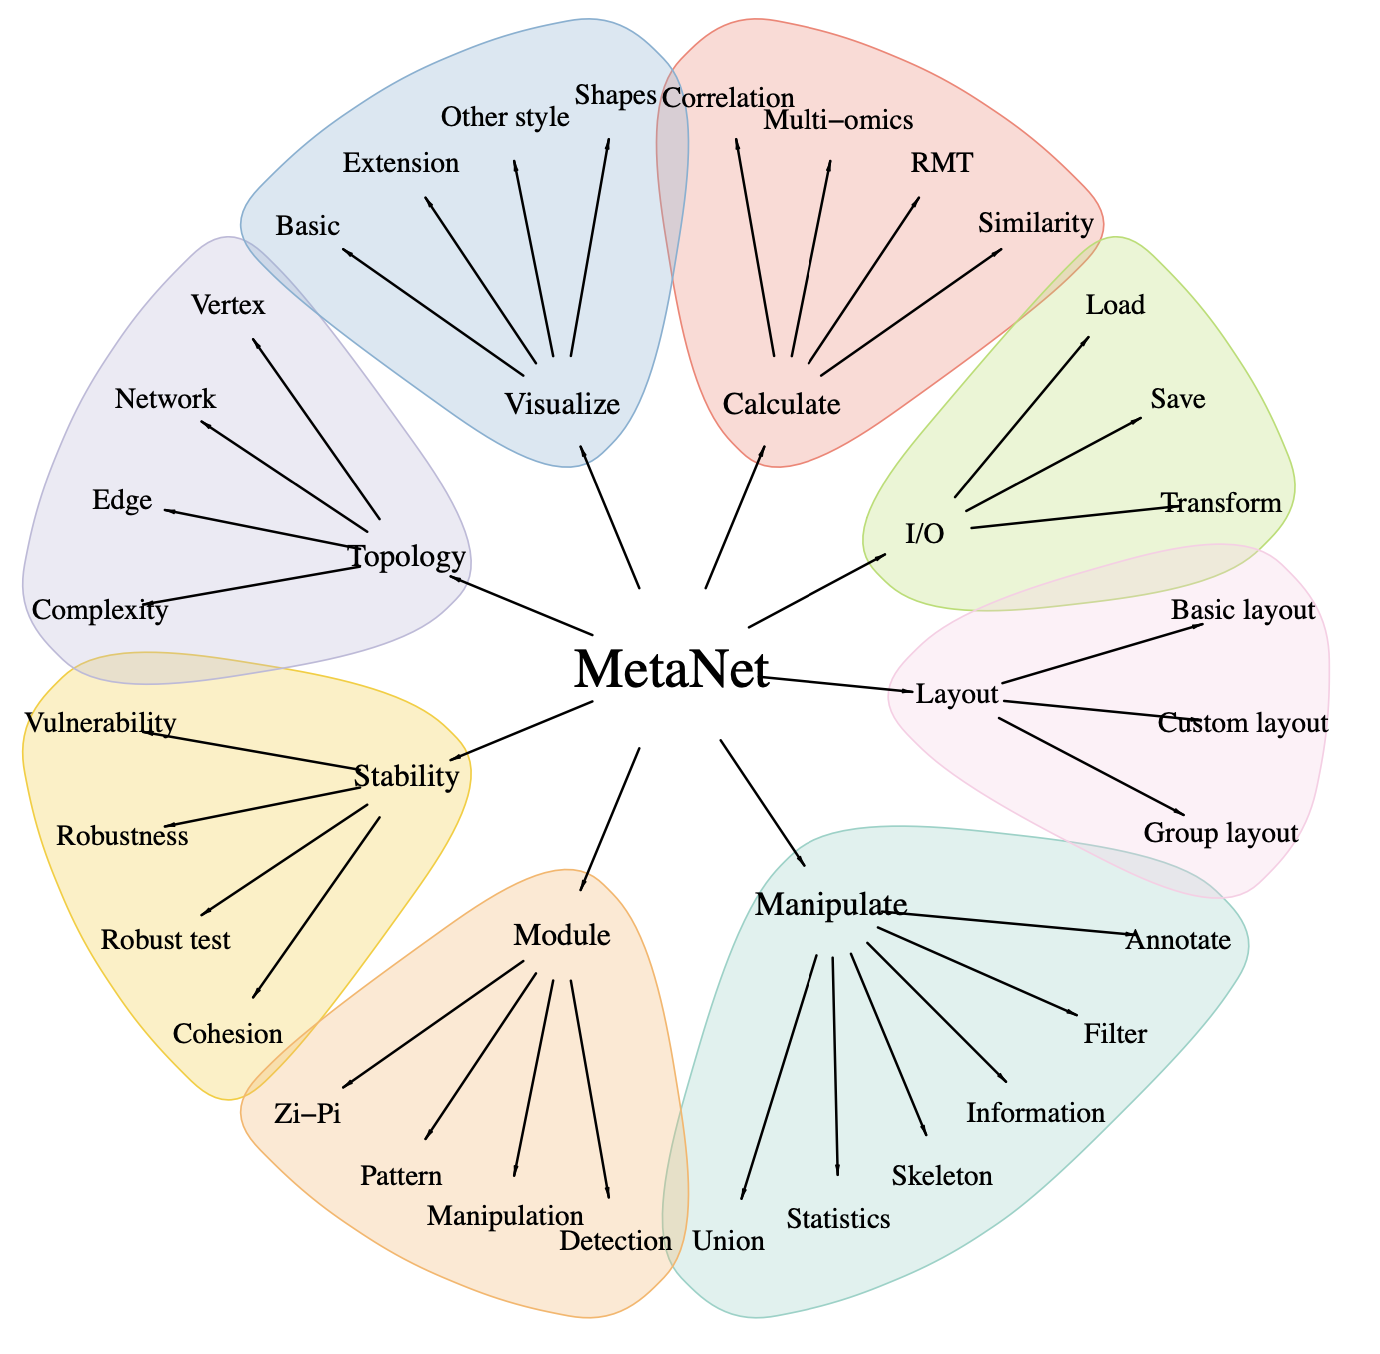
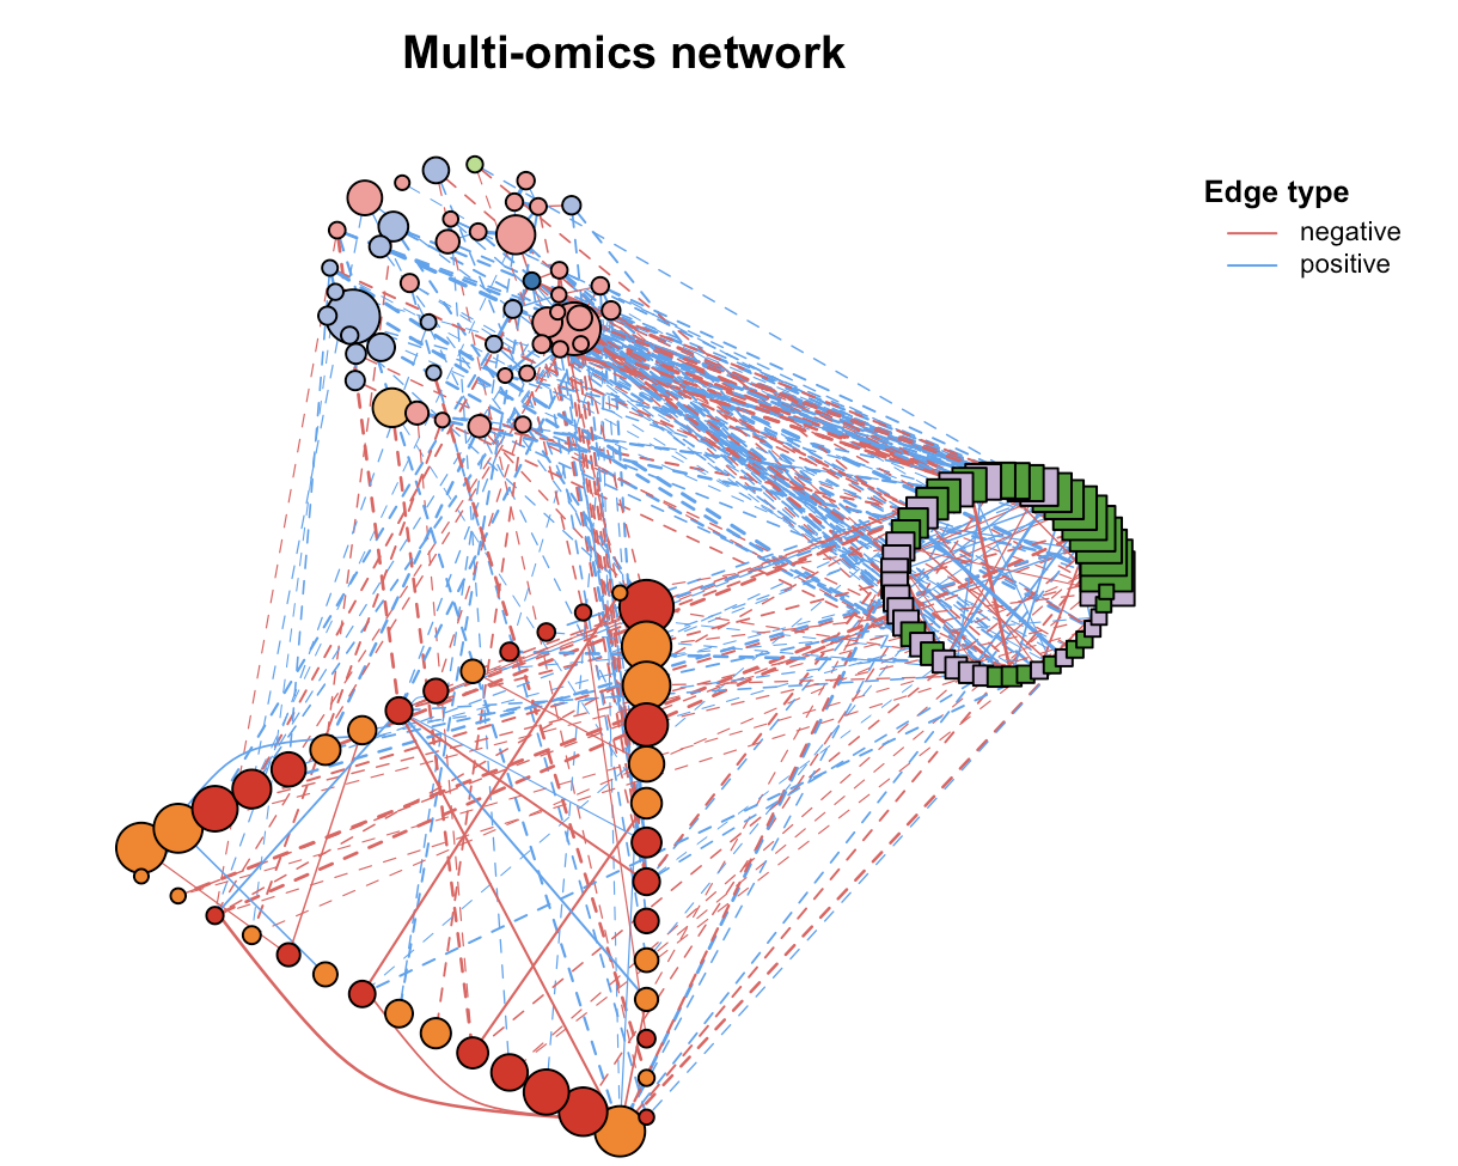
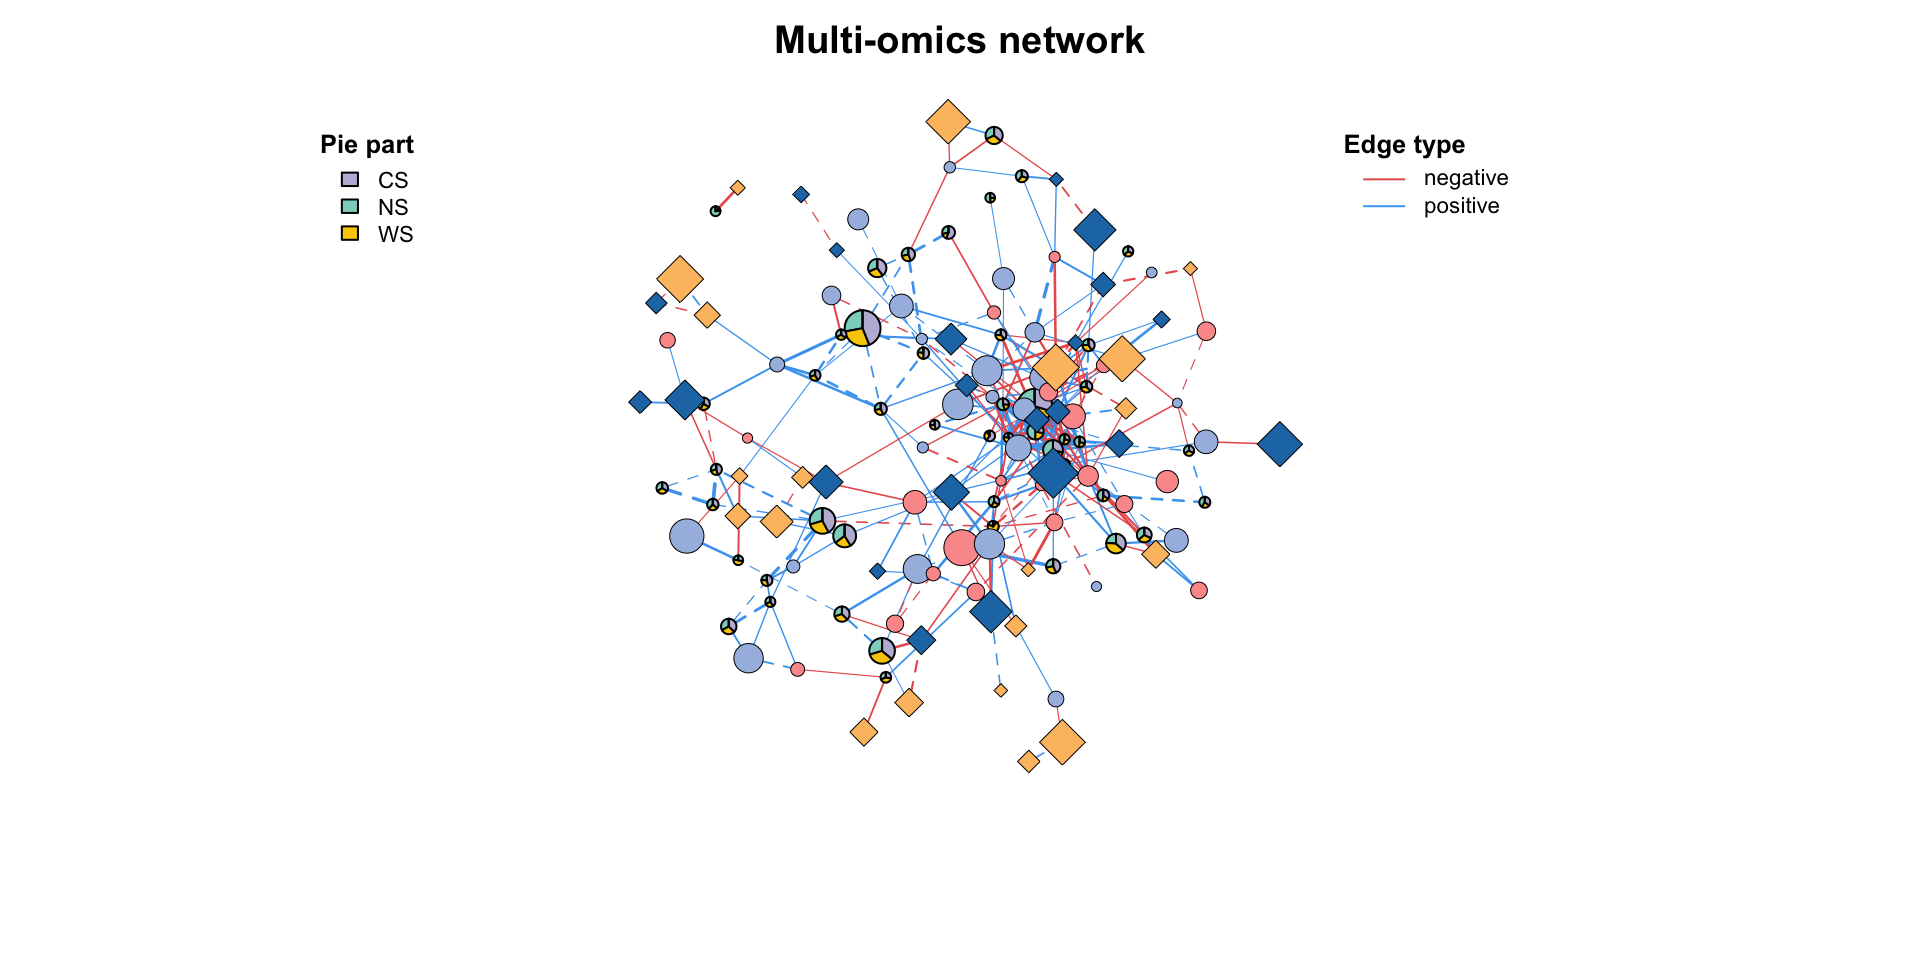
MetaNet features
library(MetaNet)
multi_net_build(list(
  Microbiome = micro,
  Metabolome = metab,
  Transcriptome = transc
)) -> multi1
# set vertex_class
multi1_with_anno <- c_net_set(multi1, micro_g, metab_g, transc_g,
                              vertex_class = c("Phylum", "kingdom", "type"))
# set vertex_size
multi1_with_anno <- c_net_set(multi1_with_anno,
  data.frame("Abundance1" = colSums(micro)),
  data.frame("Abundance2" = colSums(metab)),
  data.frame("Abundance3" = colSums(transc)),
  vertex_size = paste0("Abundance", 1:3)
)
plot(multi1_with_anno)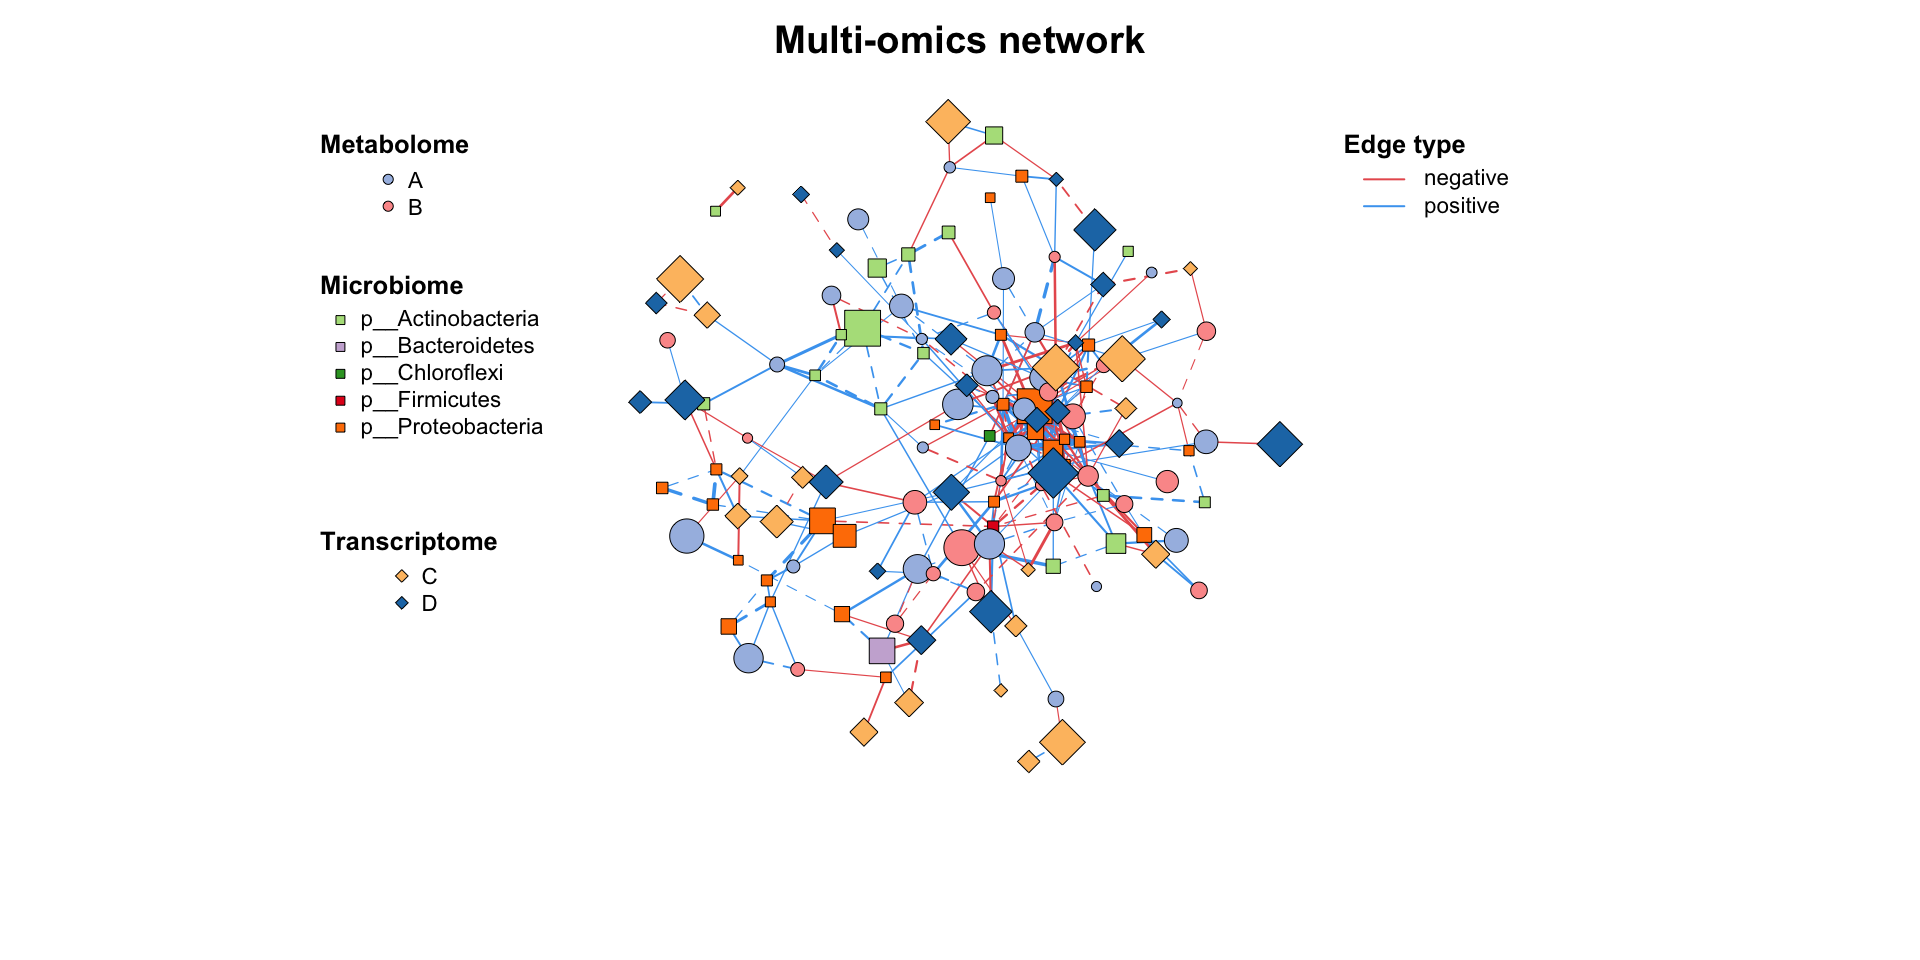
MetaNet features
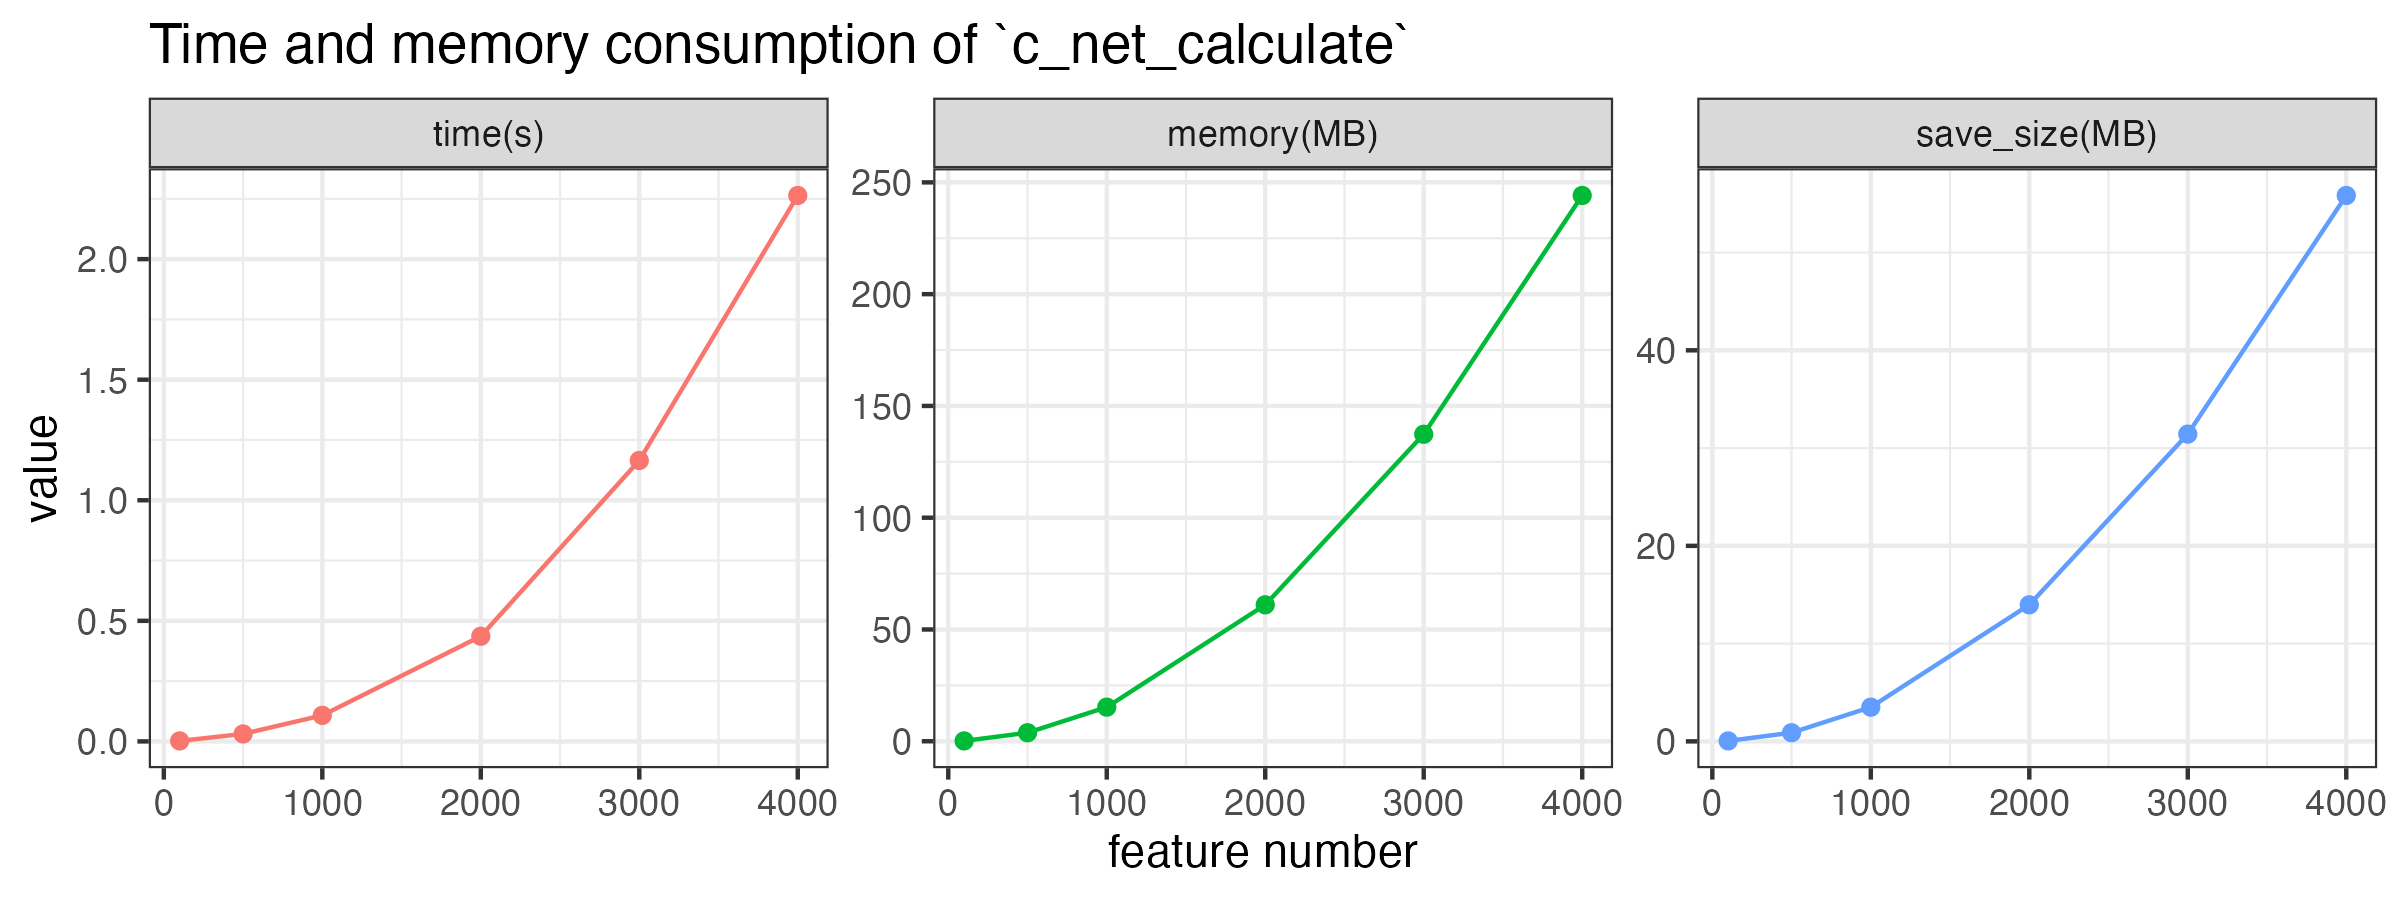
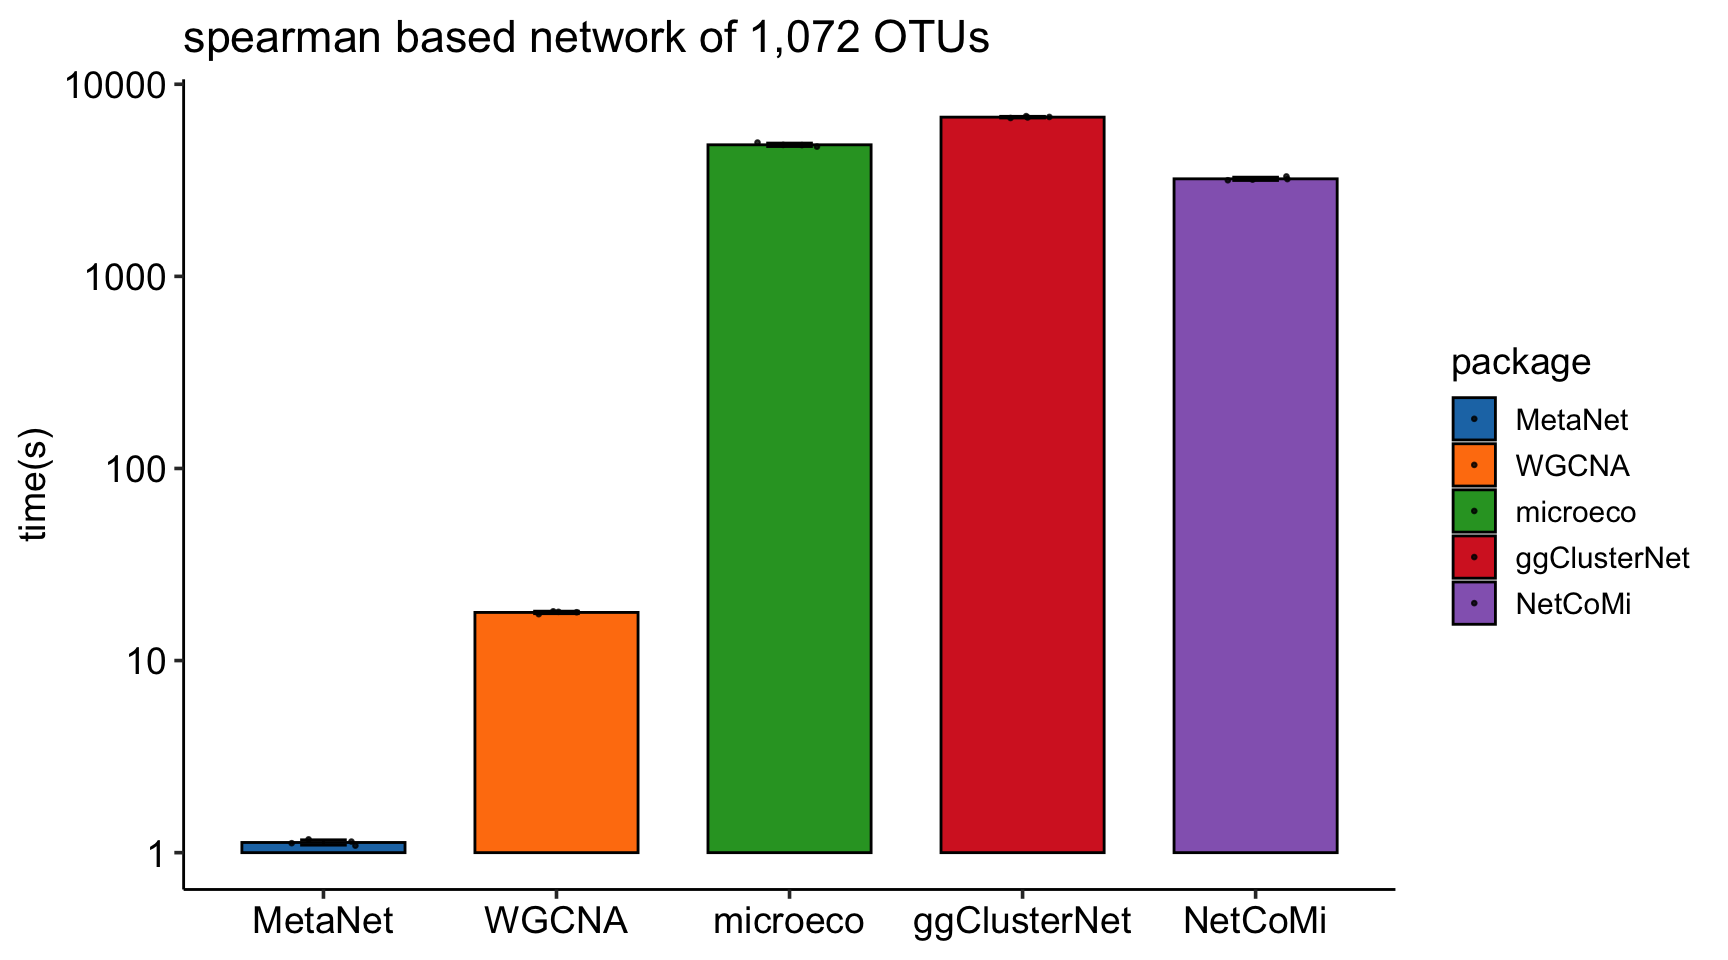
MetaNet features
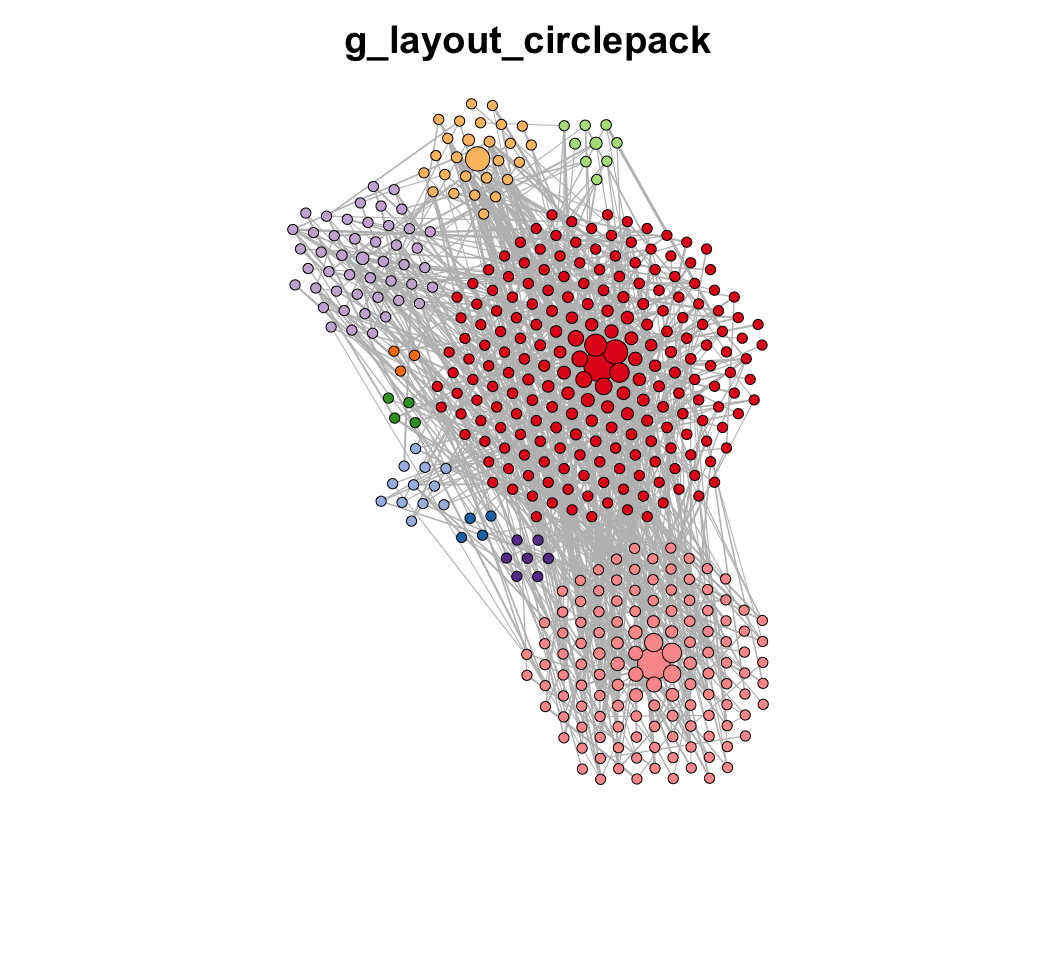
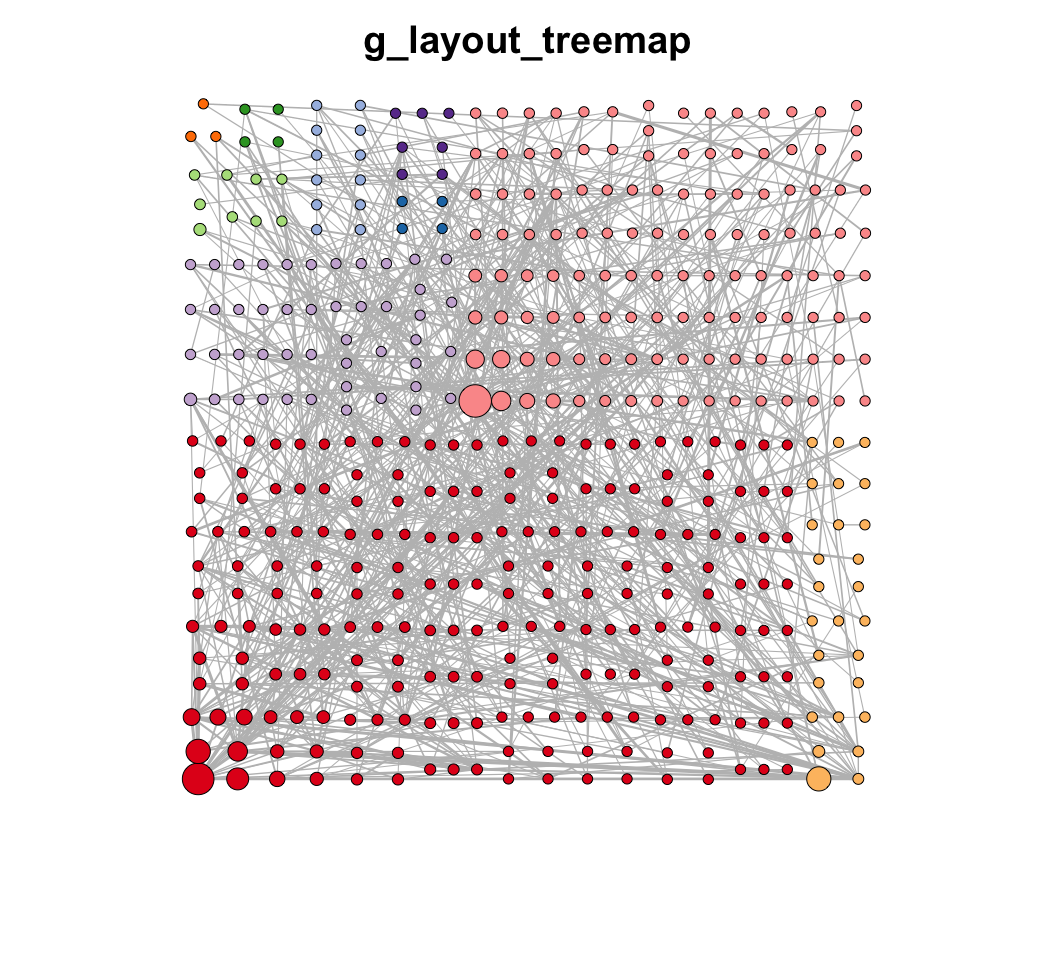
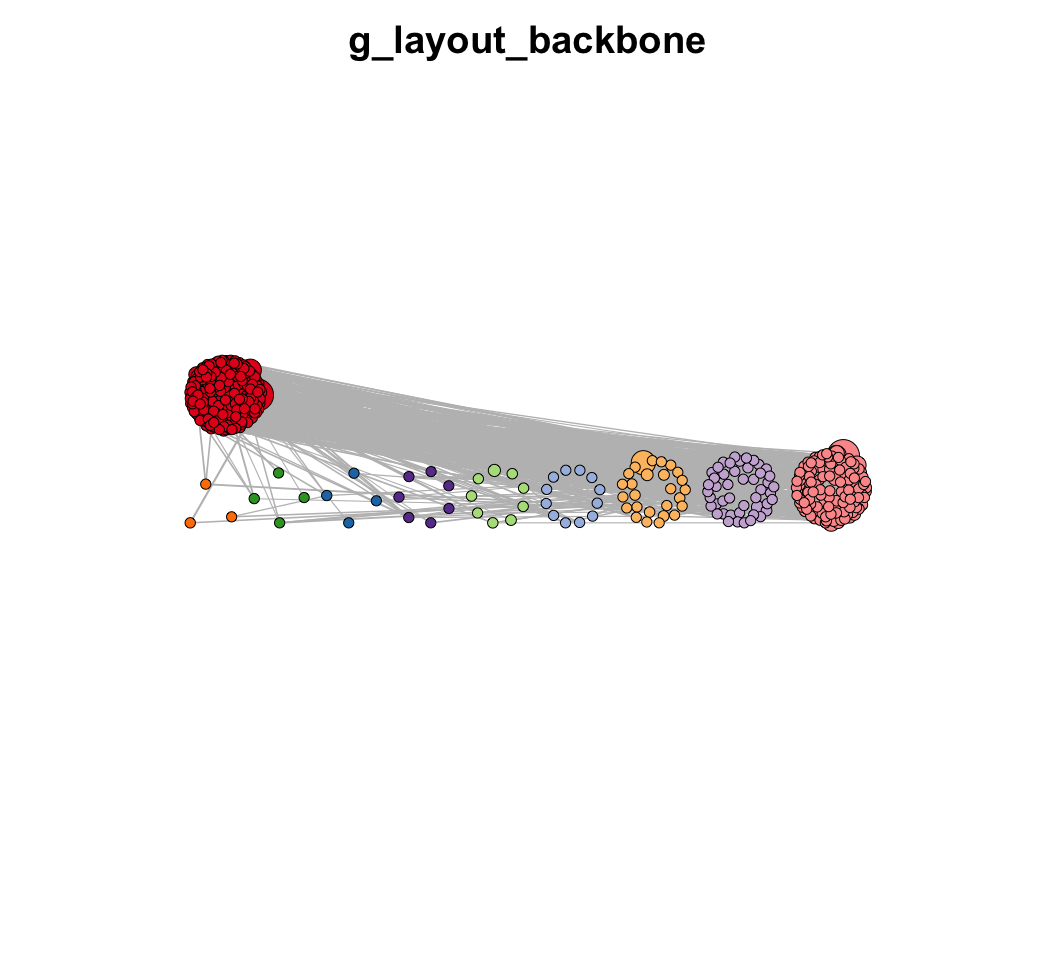
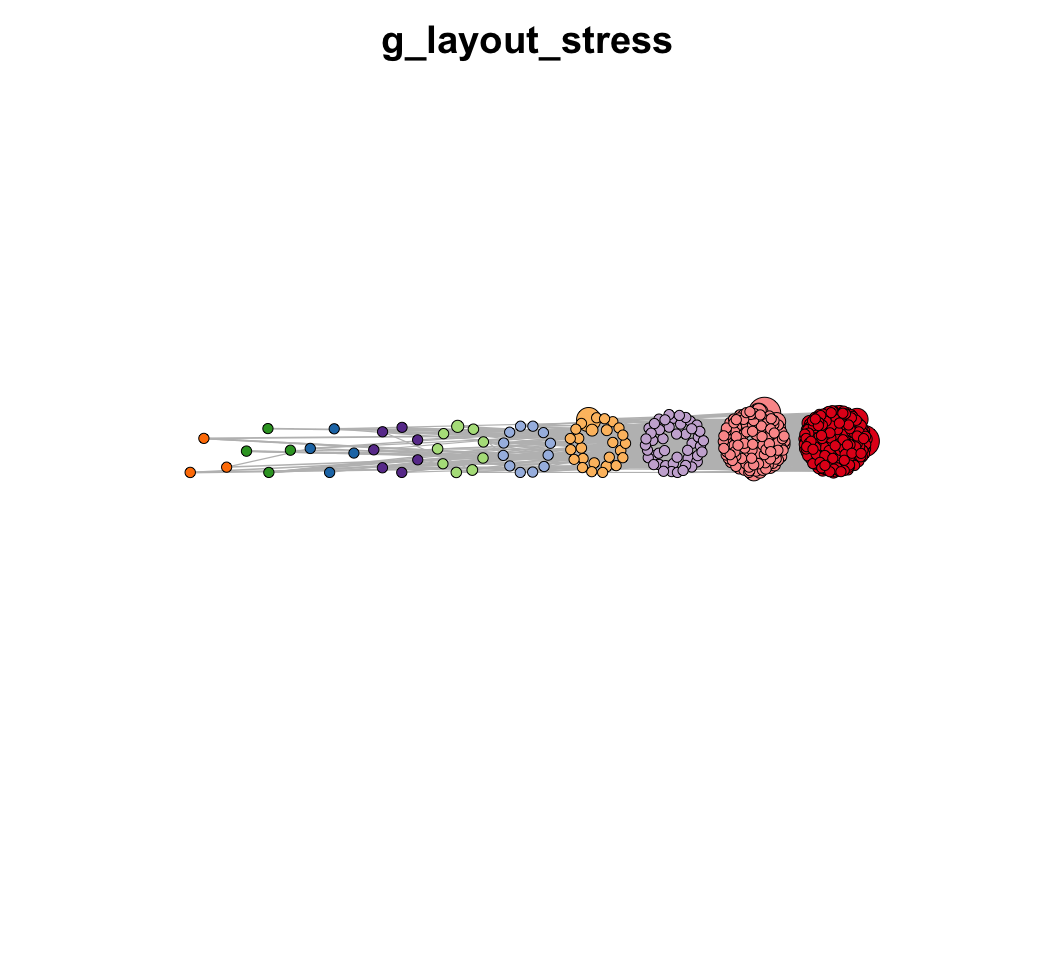
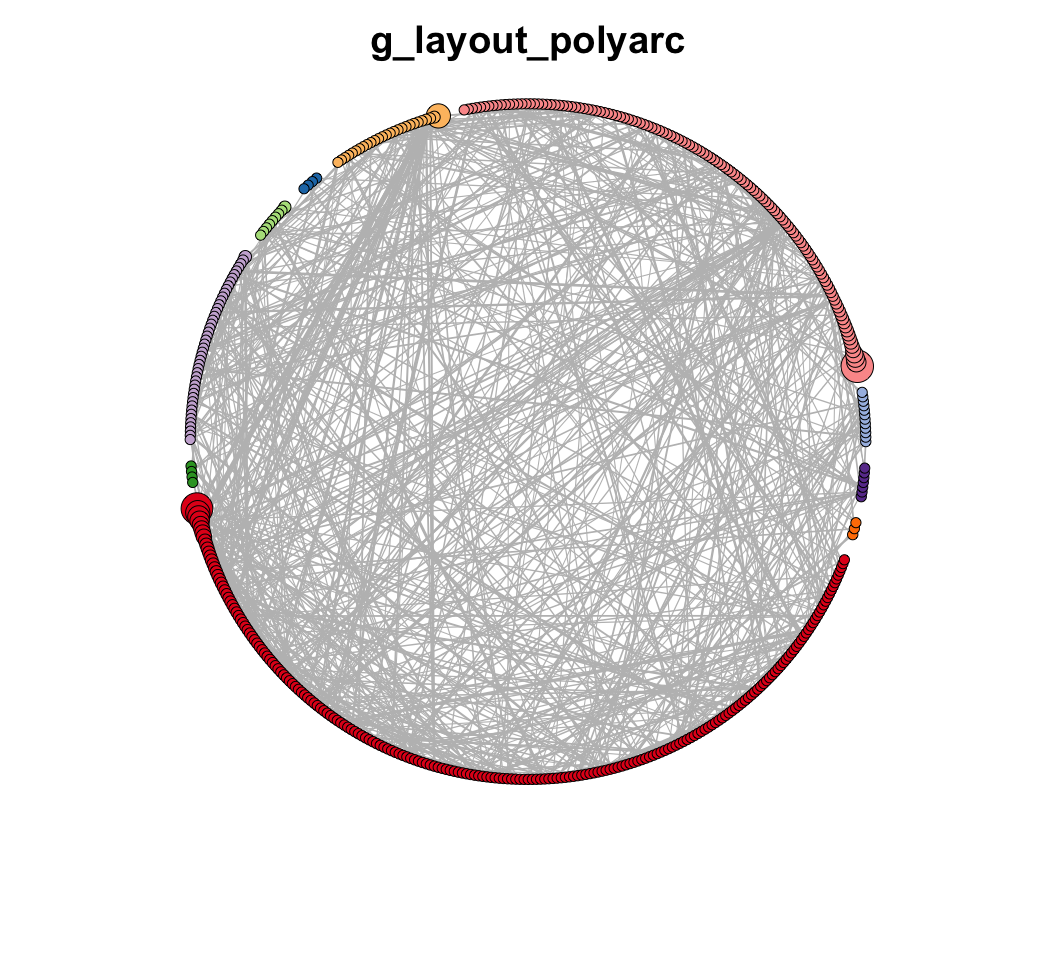
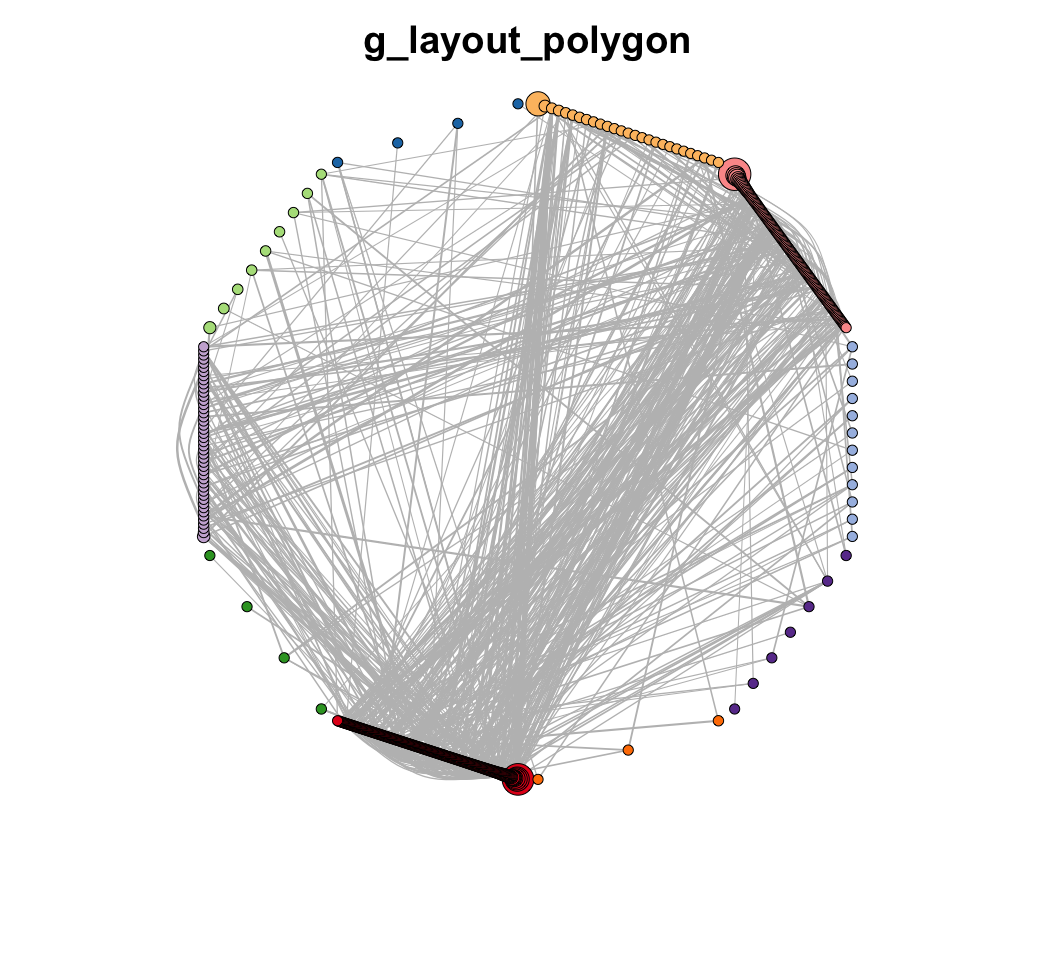
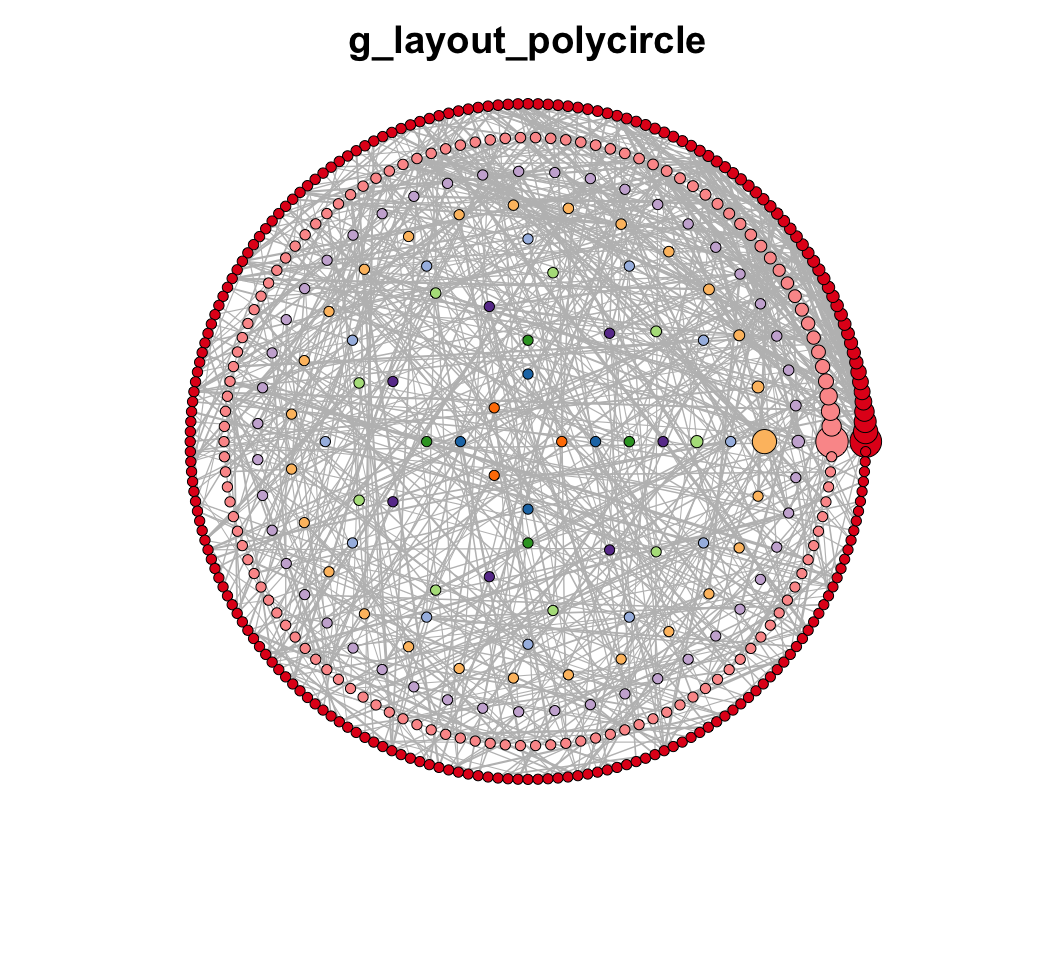
MetaNet features
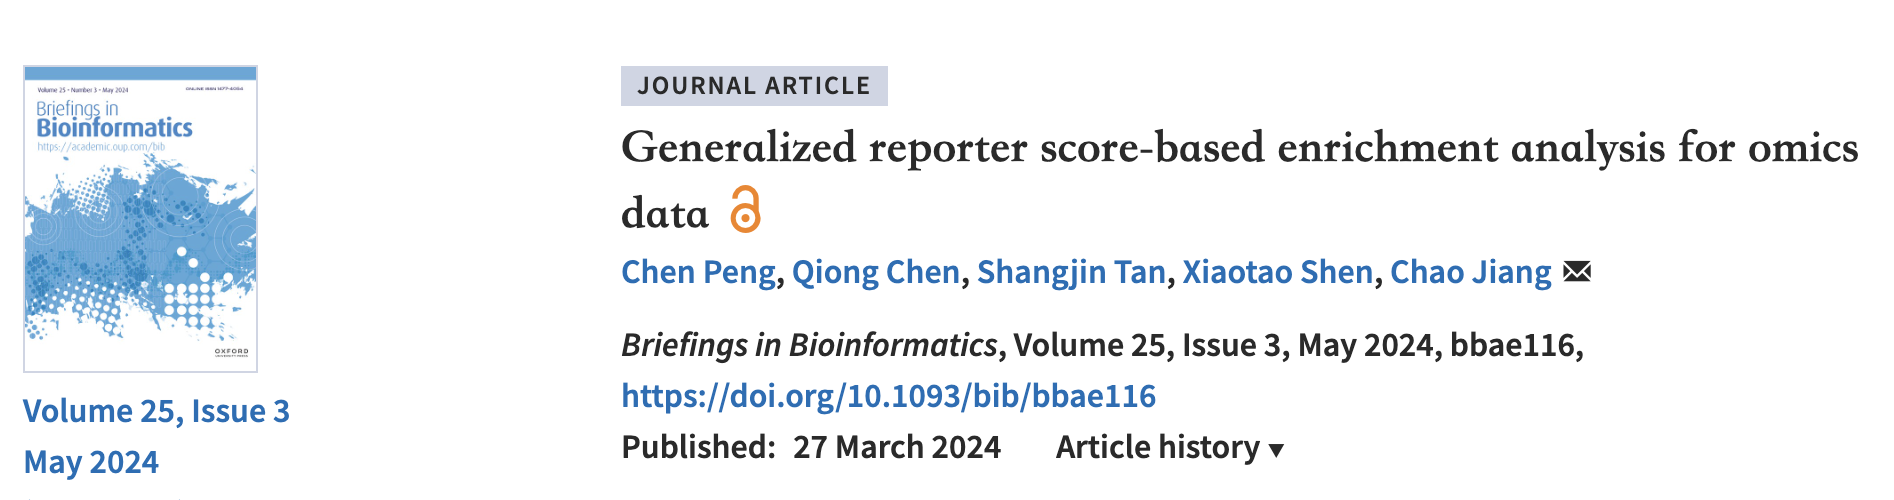
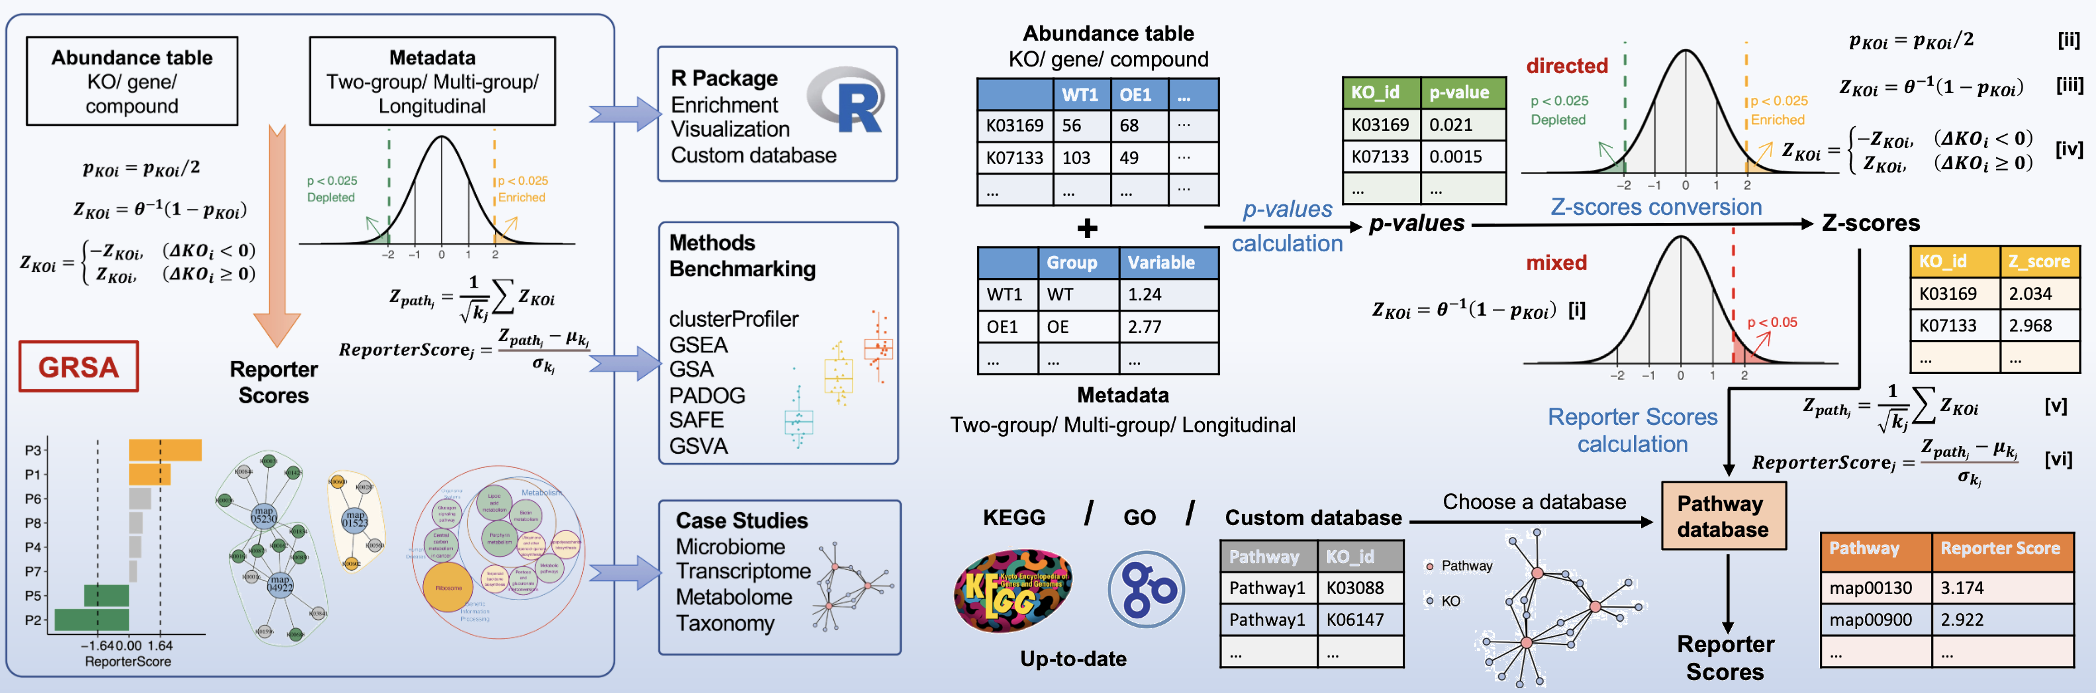
ReporterScore 
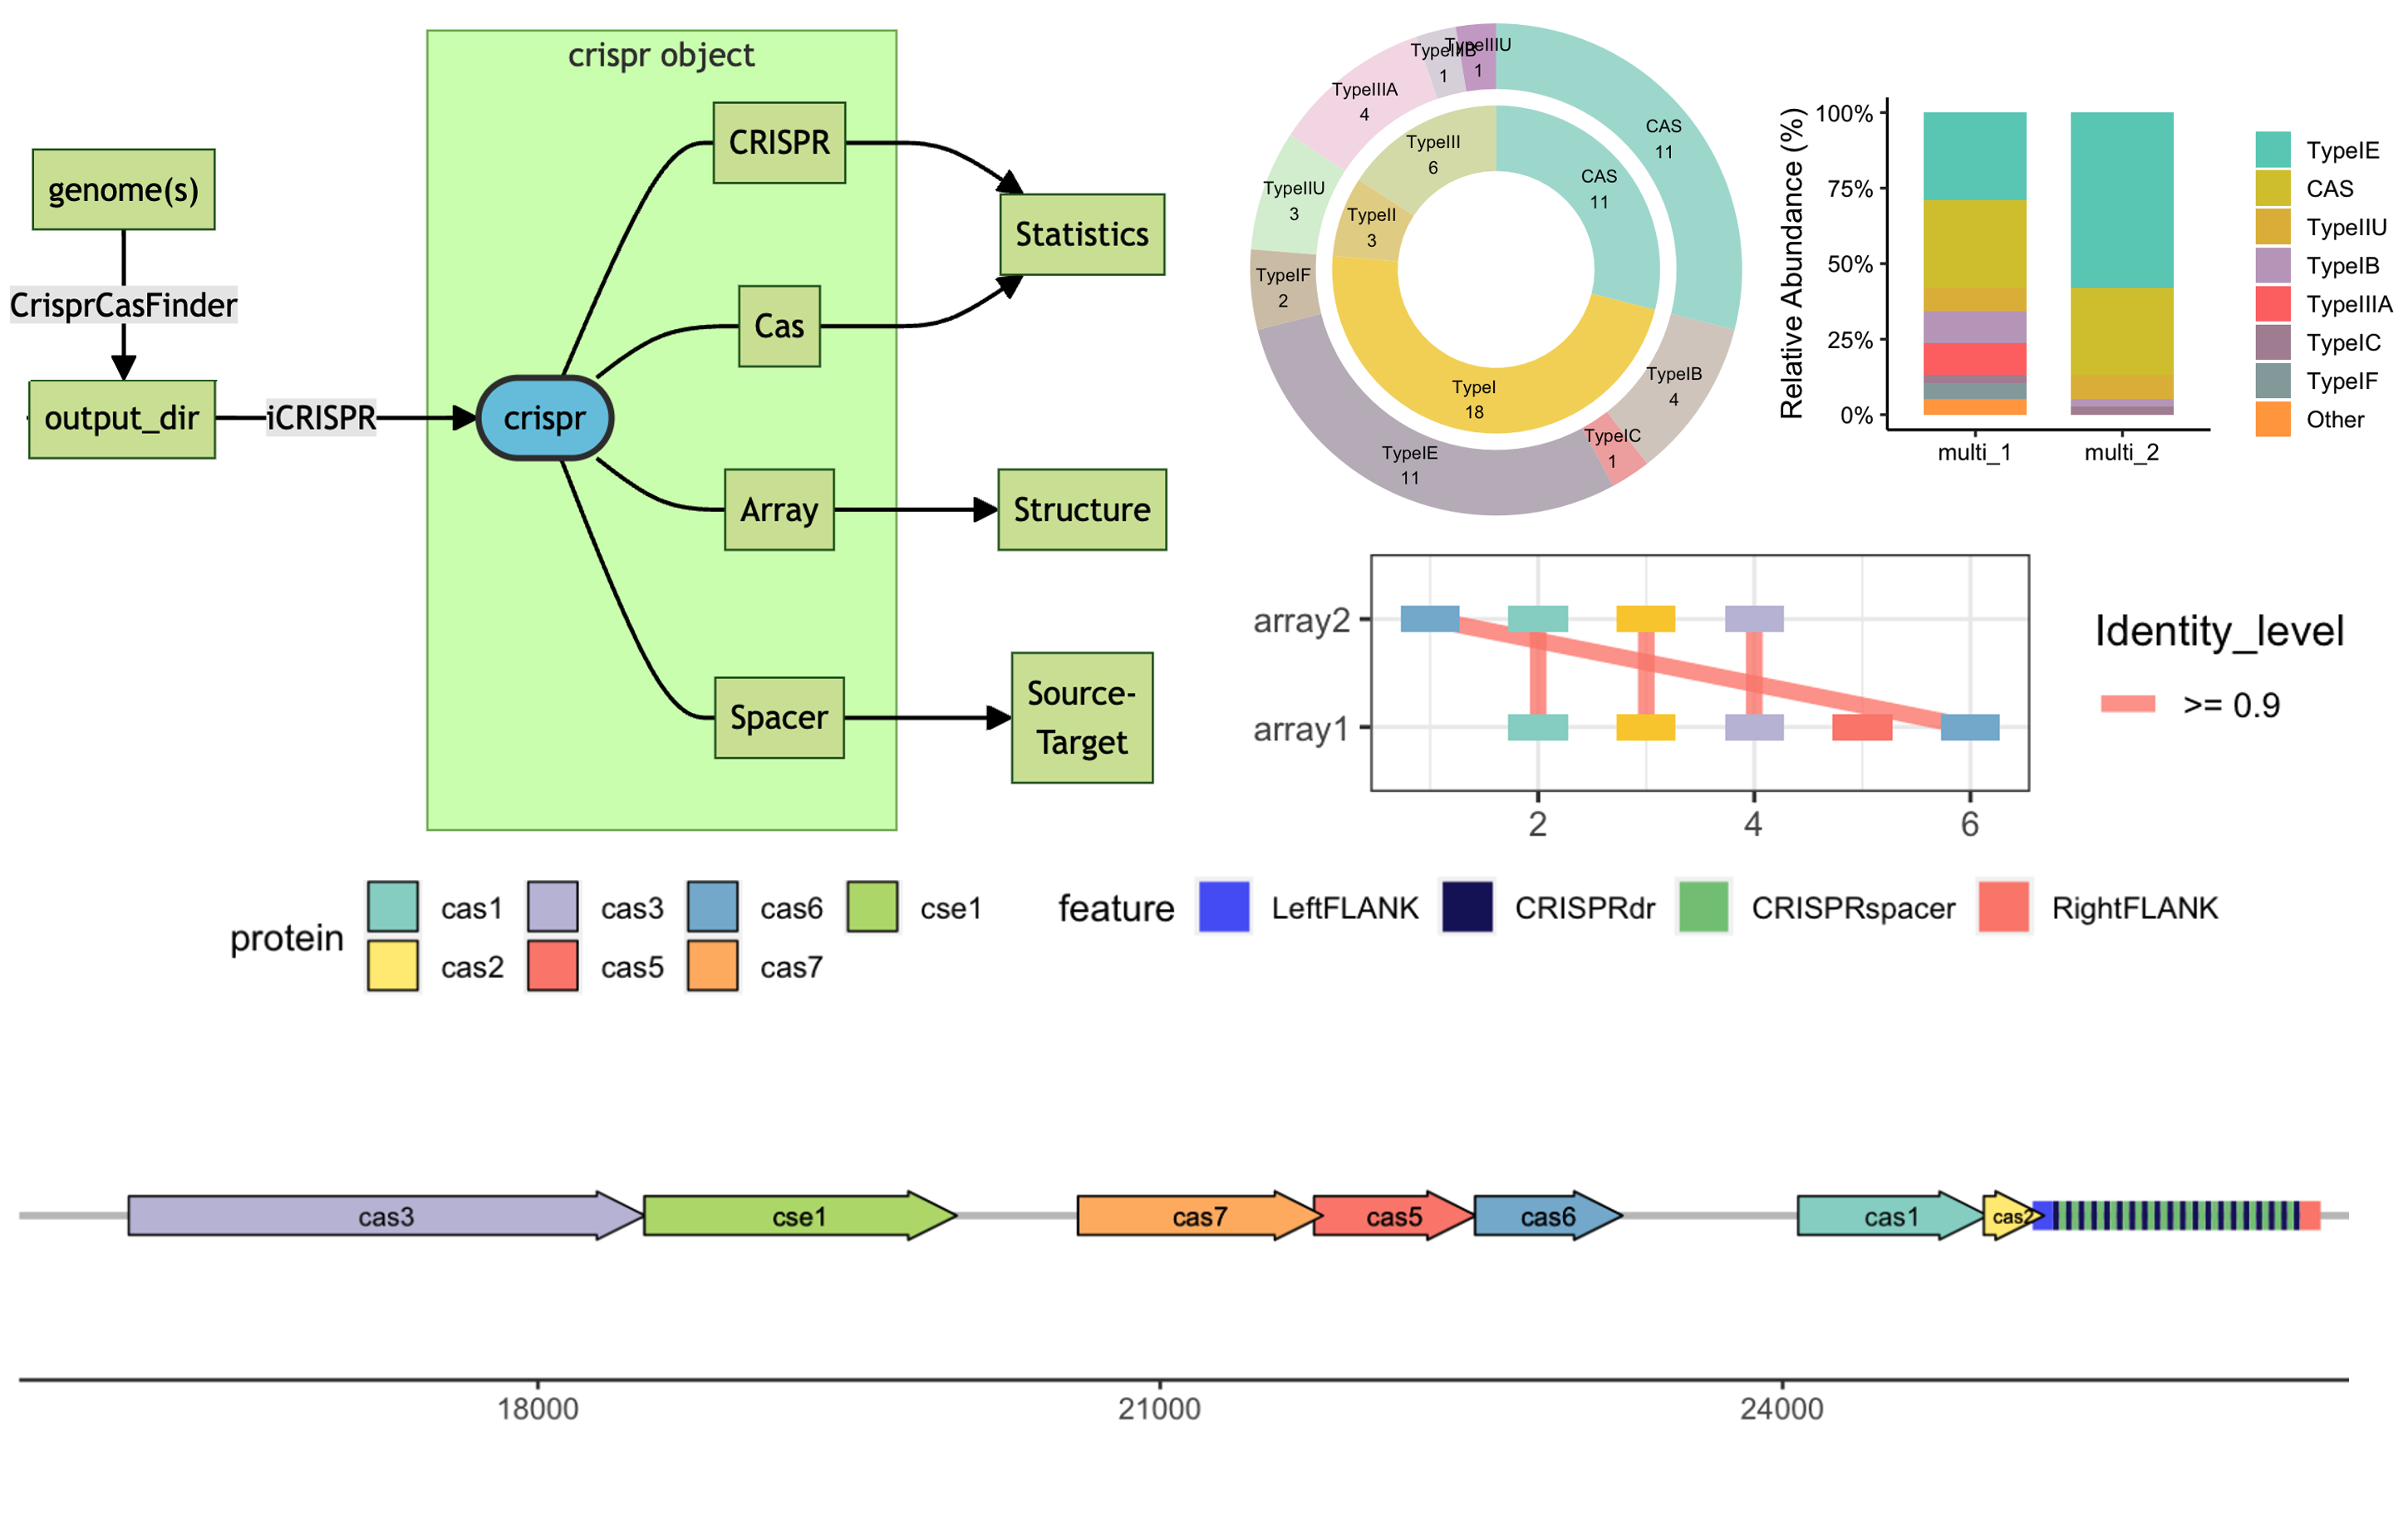
iCRISPR 
CRISPR/Cas9 system analysis in genomics and metagenomics.
plot4fun 
It provides some interesting functions for plotting.


More Resources
R tips for advanced use

Official account

Thanks for your attention! 🙏