Introduction
上次已经在一篇推文中介绍过了微生物组分析常用的功能富集分析方法以及reporter score方法的原理,并且也介绍了我开发的R包ReporterScore。
但时那个时候R包写的还比较粗糙,功能也不多,最近进一步优化了这个包的各种功能,支持两种模式,多种统计检验方法,支持两组甚至更多组的实验设计(这个挺好用的),KEGG数据库的同步做的也比较好了,还增加了一些可视化形式。
以下是我给这个R包github主页(https://github.com/Asa12138/ReporterScore)下写的介绍和用法,这里简单翻译一下贴过来了。但其实里面还有不少功能没在下面写出,可以在R包里探索一下,哈哈。
Citation
这个包暂时还没有在刊物上发表,要在出版物中引用 ReporterScore,请使用:
Chen Peng, Chao Jiang. ReporterScore: an R package for Reporter Score-based Microbial Enrichment Analysis. R package (2023), https://github.com/Asa12138/ReporterScore
🤗也欢迎在GitHub上点个star⭐️
Install
|
|
Usage
1. Inputdata (KO abundance table and metadata)
通常,我们可以使用KEGG数据库来注释我们的微生物组测序数据,特别是环境微生物组,因为KEGG相对来说更全面(当然大部分还是unknown)。
具体方法包括直接使用blast对KEGG序列数据库进行比对,使用KEGG官方mapper软件,使用EggNOG数据库并将结果转化为KEGG注释。
这样我们就可以得到一个KO丰度表(行是KO,列是样本)用于我们的富集分析:
|
|
##                WT1         WT2         WT3         WT4         WT5         WT6
## K03169 0.002653545 0.005096380 0.002033923 0.000722349 0.003468322 0.001483028
## K07133 0.000308237 0.000280458 0.000596527 0.000859854 0.000308719 0.000878098
## K03088 0.002147068 0.002030742 0.003797459 0.004161979 0.002076596 0.003091182
## K03530 0.003788366 0.000239298 0.000445817 0.000557271 0.000222969 0.000529624
## K06147 0.000785654 0.001213630 0.001312569 0.001662740 0.002387006 0.001725797
## K05349 0.001816325 0.002813642 0.003274701 0.001089906 0.002371921 0.001795214
还需要提供实验设计的元数据metadata(行是样本,列是组)。
|
|
##     Group Group2
## WT1    WT     G3
## WT2    WT     G3
## WT3    WT     G3
## WT4    WT     G3
## WT5    WT     G3
## WT6    WT     G1
2. Pathway database
ReporterScore内置了KEGG 通路和模块数据库(2023-08 版)用于KO 丰度表分析。
你可以使用 load_KOlist() 查看并使用 update_KO_file() 更新这些数据库(通过 KEGG API),因为使用最新的数据库非常重要。
或者你可以使用custom_modulelist()自定义你自己的通路数据库(感兴趣的基因集)。
|
|
3. One step enrichment
使用函数reporter_score可以一步得到reporter score结果。
有一些重要的参数可供调节:
- mode: “mixed” 或 “directed”(仅适用于两组差异分析或多组相关分析),详细信息参见
pvalue2zs。 - 方法:统计检验类型。 默认为”wilcox.test”:
t.test(参数)和wilcox.test(非参数)。 对两组样品进行比较。 如果分组变量包含两个以上水平,则执行成对比较。 -anova(参数)和kruskal.test(非参数)。 执行比较多个组的单向方差分析测试。- “pearson”、“kendall”或”spearman”(相关分析),请参见
cor。
- p.adjust.method:用于测试结果的p.adjust.method,参见
p.adjust。 - type/modulelist:选择通路数据库,默认数据库为”pathway”或”module”,或使用自定义的模块列表。
group作为因子变量,第一个水平将被设置为对照组,你可以更改因子水平来改变你的比较。
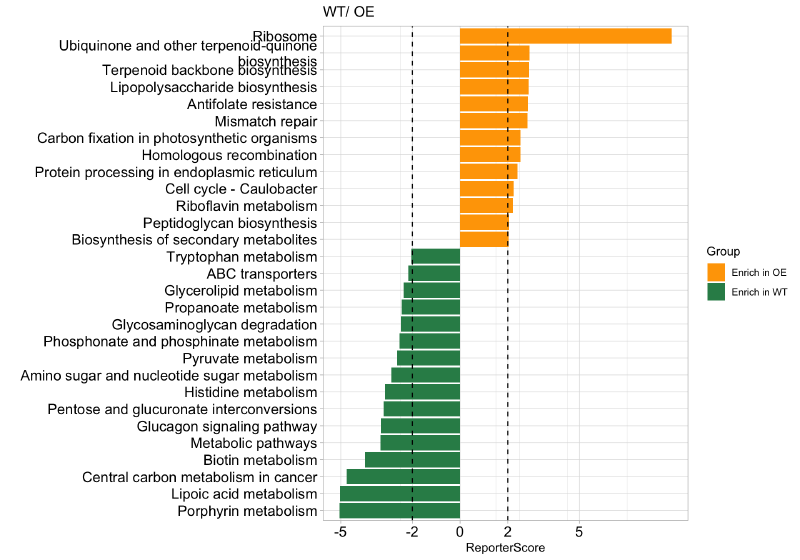
例如,我们想要比较两组”WT-OE”,并使用”directed”模式,因为我们只想知道 OE 组 中哪些通路被富集或耗尽:
|
|
结果是一个”reporter_score”对象:
| elements | description |
|---|---|
kodf |
你的输入 KO_abundance 表 |
ko_pvalue |
ko 统计结果包含 p.value |
ko_stat |
ko统计结果包含p.value和z_score |
reporter_s |
在每个途径中的reporter score |
modulelist |
默认 KOlist 或自定义模块列表数据框 |
group |
你的数据中的比较组 |
metadata |
示例信息数据框包含组 |
4. Visualization
绘制最显著富集的通路:
|
|

当我们聚焦于一条通路时,例如 “map00780”:
|
|

或者显示为网络:
|
|

我们也可以查看通路中每个 KO 的丰度:
|
|

或者热图形式呈现:
|
|

example for “mixed”
如果我们的实验设计超过两组,我们可以选择多组比较和“mixed”模式:
|
|

Details
Step by step
一步函数 reporter_score 由三部分组成:
ko.test:此函数有助于通过各种内置方法计算 KO_abundance 的 p-value,例如差异分析(t.test、wilcox.test、kruskal.test、anova)或相关分析(pearson 、spearman、kendall)。 你还可以通过其他方法计算 KO_abundance 的 p-value,例如“DESeq2”、“Edger”、“Limma”、“ALDEX”、“ANCOM”,并自行进行 p值矫正,然后跳过ko.test步骤转到步骤2…pvalue2zs:该函数将 KO 的 p-value 转换为 Z-score(选择模式: “mixed” 或 “directed”)。get_reporter_score该函数计算特定数据库中每个通路的reporter score。 你可以在此处使用自定义数据库。
这样你就可以一步一步得到reporter score。
Other enrichment methods
ReporterScore 还提供了其他丰富方法,如 KO_fisher(fisher.test)、KO_enrich(fisher.test, from clusterProfiler)、KO_gsea (GSEA, from clusterProfiler),输入数据来自 reporter_score,并且也支持自定义数据库,因此你可以轻松比较各种富集方法的结果并进行全面分析:
|
|

|
|

KO levels
KEGG BRITE 是一个层次分类系统的集合,捕获各种生物对象的功能层次结构,特别是那些表示为 KEGG 对象的功能层次结构。
我们收集了 k00001 KEGG Orthology (KO) 表,以便你可以总结每个级别的丰度。 使用 load_KO_htable 获取 KO_htable 并使用 update_KO_htable 进行更新。 使用 up_level_KO 可以升级到“pathway”、“module”、“level1”、“level2”、“level3”、“module1”、“module2”、“module3”之一中的特定级别。
|
|
## # A tibble: 6 × 8
##   level1_id level1_name level2_id level2_name        level3_id level3_name KO_id
##   <chr>     <chr>       <chr>     <chr>              <chr>     <chr>       <chr>
## 1 A09100    Metabolism  B09101    Carbohydrate meta… map00010  Glycolysis… K008…
## 2 A09100    Metabolism  B09101    Carbohydrate meta… map00010  Glycolysis… K124…
## 3 A09100    Metabolism  B09101    Carbohydrate meta… map00010  Glycolysis… K008…
## 4 A09100    Metabolism  B09101    Carbohydrate meta… map00010  Glycolysis… K250…
## 5 A09100    Metabolism  B09101    Carbohydrate meta… map00010  Glycolysis… K018…
## 6 A09100    Metabolism  B09101    Carbohydrate meta… map00010  Glycolysis… K068…
## # ℹ 1 more variable: KO_name <chr>
|
|

|
|

Reference
-
Patil, K. R. & Nielsen, J. Uncovering transcriptional regulation of metabolism by using metabolic network topology. Proc Natl Acad Sci U S A 102, 2685–2689 (2005).
-
L. Liu, R. Zhu, D. Wu, Misuse of reporter score in microbial enrichment analysis. iMeta. 2, e95 (2023).
